RBS 2014 Annual Report Download - page 22
Download and view the complete annual report
Please find page 22 of the 2014 RBS annual report below. You can navigate through the pages in the report by either clicking on the pages listed below, or by using the keyword search tool below to find specific information within the annual report.-
 1
1 -
2
-
3
-
4
-
5
-
6
-
7
-
8
-
9
-
10
-
11
-
 12
12 -
 13
13 -
 14
14 -
 15
15 -
 16
16 -
 17
17 -
 18
18 -
 19
19 -
 20
20 -
 21
21 -
 22
22 -
 23
23 -
 24
24 -
 25
25 -
 26
26 -
 27
27 -
 28
28 -
 29
29 -
 30
30 -
 31
31 -
 32
32 -
33
-
34
-
35
-
36
-
37
-
38
-
39
-
40
-
41
-
42
-
43
-
44
-
45
-
46
-
47
-
48
-
49
-
50
-
51
-
52
-
53
-
54
-
55
-
56
-
57
-
58
-
59
-
60
-
61
-
62
-
63
-
64
-
65
-
66
-
67
-
68
-
69
-
70
-
71
-
72
-
73
-
74
-
75
-
76
-
77
-
78
-
79
-
80
-
81
-
82
-
83
-
84
-
85
-
86
-
87
-
88
-
89
-
90
-
91
-
92
-
93
-
94
-
95
-
96
-
97
-
98
-
99
-
100
-
101
-
102
-
103
-
104
-
105
-
106
-
107
-
108
-
109
-
110
-
111
-
112
-
113
-
114
-
115
-
116
-
117
-
118
-
119
-
120
-
121
-
122
-
123
-
124
-
125
-
126
-
127
-
128
-
129
-
130
-
131
-
132
-
133
-
134
-
135
-
136
-
137
-
138
-
139
-
140
-
141
-
142
-
143
-
144
-
145
-
146
-
147
-
148
-
149
-
150
-
151
-
152
-
153
-
154
-
155
-
156
-
157
-
158
-
159
-
160
-
161
-
162
-
163
-
164
-
165
-
166
-
167
-
168
-
169
-
170
-
171
-
172
-
173
-
174
-
175
-
176
-
177
-
178
-
179
-
180
-
181
-
182
-
183
-
184
-
185
-
186
-
187
-
188
-
189
-
190
-
191
-
192
-
193
-
194
-
195
-
196
-
197
-
198
-
199
 |
 |
20
RBS – Interim Results 2015
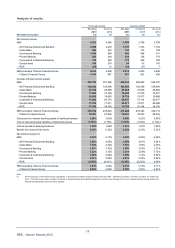
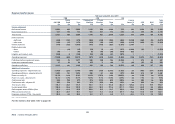
Analysis of results
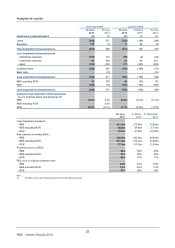
Half year ended Quarter ended
30 June 30 June 30 June 31 March 30 June
2015 2014 2015 2015 2014
Operating expenses £m £m £m £m £m
Staff expenses 3,075 3,340 1,517 1,558 1,693
Premises and equipment 859 1,079 372 487 485
Other 1,133 1,292 622 511 605
Restructuring costs* 1,503 514 1,050 453 385
Litigation and conduct costs 1,315 250 459 856 250
Administrative expenses 7,885 6,475 4,020 3,865 3,418
Depreciation and amortisation 418 551 186 232 282
Write down of intangible assets -82 - - -
Operating expenses 8,303 7,108 4,206 4,097 3,700
A
djusted operating expenses (1) 5,485 6,344 2,697 2,788 3,065
*Restructuring costs comprise:
- staff expenses 348 196 293 55 153
- premises, equipment, depreciation and amortisation 341 199 51 290 138
- other 814 119 706 108 94
Restructuring costs 1,503 514 1,050 453 385
Staff costs as a % of total income 35% 33% 35% 36% 34%
Cost:income ratio 95% 71% 96% 95% 75%
Cost:income ratio - adjusted (1) 63% 64% 62% 64% 62%
Employee numbers (FTE - thousands) 109.2 113.6 109.2 109.2 113.6
Note:
(1) Excluding restructuring costs and litigation and conduct costs.
Key points
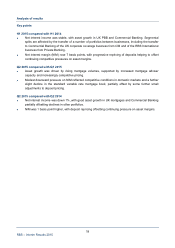
H1 2015 compared with H1 2014
• Operating expenses rose as a result of higher restructuring and litigation and conduct costs.
• Adjusted operating expenses were 14% lower, reflecting the benefits of the bank’s cost reduction
programme. This included an 8% reduction in staff expenses, driven by a 4,400 reduction in
headcount, principally in higher cost businesses.
Q2 2015 compared with Q1 2015
• Operating expenses were 3% higher, with an increase in restructuring costs (up £597 million) partially
offset by lower litigation and conduct charges (down £397 million).
• Adjusted operating expenses fell by 3%, including an 8% reduction within CIB.
Q2 2015 compared with Q2 2014
• Operating expenses were 14% higher reflecting increased restructuring and litigation and conduc
t
costs.
• Adjusted operating expenses fell by 12%, driven by a reduction in staff expenses.