RBS 2014 Annual Report Download - page 63
Download and view the complete annual report
Please find page 63 of the 2014 RBS annual report below. You can navigate through the pages in the report by either clicking on the pages listed below, or by using the keyword search tool below to find specific information within the annual report.-
 1
1 -
2
-
3
-
4
-
5
-
6
-
7
-
8
-
9
-
10
-
11
-
12
-
13
-
14
-
15
-
16
-
17
-
18
-
19
-
20
-
21
-
22
-
23
-
24
-
25
-
26
-
27
-
28
-
29
-
30
-
31
-
32
-
33
-
34
-
35
-
36
-
37
-
38
-
39
-
40
-
41
-
42
-
43
-
44
-
45
-
46
-
47
-
48
-
49
-
50
-
51
-
52
-
 53
53 -
 54
54 -
 55
55 -
 56
56 -
 57
57 -
 58
58 -
 59
59 -
 60
60 -
 61
61 -
 62
62 -
 63
63 -
 64
64 -
 65
65 -
 66
66 -
 67
67 -
 68
68 -
 69
69 -
 70
70 -
 71
71 -
 72
72 -
 73
73 -
74
-
75
-
76
-
77
-
78
-
79
-
80
-
81
-
82
-
83
-
84
-
85
-
86
-
87
-
88
-
89
-
90
-
91
-
92
-
93
-
94
-
95
-
96
-
97
-
98
-
99
-
100
-
101
-
102
-
103
-
104
-
105
-
106
-
107
-
108
-
109
-
110
-
111
-
112
-
113
-
114
-
115
-
116
-
117
-
118
-
119
-
120
-
121
-
122
-
123
-
124
-
125
-
126
-
127
-
128
-
129
-
130
-
131
-
132
-
133
-
134
-
135
-
136
-
137
-
138
-
139
-
140
-
141
-
142
-
143
-
144
-
145
-
146
-
147
-
148
-
149
-
150
-
151
-
152
-
153
-
154
-
155
-
156
-
157
-
158
-
159
-
160
-
161
-
162
-
163
-
164
-
165
-
166
-
167
-
168
-
169
-
170
-
171
-
172
-
173
-
174
-
175
-
176
-
177
-
178
-
179
-
180
-
181
-
182
-
183
-
184
-
185
-
186
-
187
-
188
-
189
-
190
-
191
-
192
-
193
-
194
-
195
-
196
-
197
-
198
-
199
 |
 |
61
RBS – Interim Results 2015
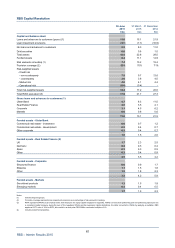
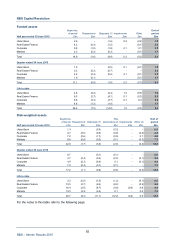
RBS Capital Resolution
30 June 31 March 31 December
2015 2015 2014
£bn £bn £bn
Capital and balance sheet
Loans and advances to customers (gross) (1) 11.0 15.1 21.9
Loan impairment provisions (5.1) (7.1) (10.9)
Net loans and advances to customers 5.9 8.0 11.0
Debt securities 0.6 0.8 1.0
Total assets 16.5 22.8 29.0
Funded assets 8.4 11.1 14.9
Risk elements in lending (1) 7.4 10.2 15.4
Provision coverage (2) 69% 70% 71%
Risk-weighted assets
- Credit risk
- non-counterparty 7.8 9.7 13.6
- counterparty 3.0 3.8 4.0
- Market risk 4.0 4.1 4.4
- Operational risk (0.4) (0.4) -
Total risk-weighted assets 14.4 17.2 22.0
Total RWA equivalent (3) 17.9 21.7 27.3
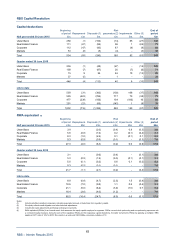
Gross loans and advances to customers (1)
Ulster Bank 4.7 6.5 11.0
Real Estate Finance 2.6 3.5 4.1
Corporate 3.1 4.5 6.2
Markets 0.6 0.6 0.6
11.0 15.1 21.9
Funded assets - Ulster Bank
Commercial real estate - investment 0.6 0.7 1.2
Commercial real estate - development 0.2 0.4 0.7
Other corporate 0.2 0.4 0.7
1.0 1.5 2.6
Funded assets - Real Estate Finance (4)
UK 1.7 2.3 2.5
Germany 0.2 0.3 0.4
Spain 0.3 0.5 0.5
Other 0.3 0.4 0.8
2.5 3.5 4.2
Funded assets - Corporate
Structured finance 0.6 0.9 1.7
Shipping 1.1 1.5 1.8
Other 1.5 1.8 2.3
3.2 4.2 5.8
Funded assets - Markets
Securitised products 1.3 1.5 1.8
Emerging markets 0.4 0.4 0.5
1.7 1.9 2.3
Notes:
(1) Includes disposal groups.
(2) Provision coverage represents loan impairment provisions as a percentage of risk elements in lending.
(3) RWA equivalent (RWAe) is an internal metric that measures the equity capital employed in segments. RWAe converts both performing and non-performing exposures into
a consistent capital measure, being the sum of the regulatory RWAs and the regulatory capital deductions, the latter converted to RWAe by applying a multiplier. RBS
applies a CET1 ratio of 10% for RCR; this results in an end point CRR RWAe conversion multiplier of 10.
(4) Includes investment properties.