Regions Bank 2012 Annual Report Download - page 100
Download and view the complete annual report
Please find page 100 of the 2012 Regions Bank annual report below. You can navigate through the pages in the report by either clicking on the pages listed below, or by using the keyword search tool below to find specific information within the annual report.-
 1
1 -
2
-
3
-
4
-
5
-
6
-
7
-
8
-
9
-
10
-
11
-
12
-
13
-
14
-
15
-
16
-
17
-
18
-
19
-
20
-
21
-
22
-
23
-
24
-
25
-
26
-
27
-
28
-
29
-
30
-
31
-
32
-
33
-
34
-
35
-
36
-
37
-
38
-
39
-
40
-
41
-
42
-
43
-
44
-
45
-
46
-
47
-
48
-
49
-
50
-
51
-
52
-
53
-
54
-
55
-
56
-
57
-
58
-
59
-
60
-
61
-
62
-
63
-
64
-
65
-
66
-
67
-
68
-
69
-
70
-
71
-
72
-
73
-
74
-
75
-
76
-
77
-
78
-
79
-
80
-
81
-
82
-
83
-
84
-
85
-
86
-
87
-
88
-
89
-
 90
90 -
 91
91 -
 92
92 -
 93
93 -
 94
94 -
 95
95 -
 96
96 -
 97
97 -
 98
98 -
 99
99 -
 100
100 -
 101
101 -
 102
102 -
 103
103 -
 104
104 -
 105
105 -
 106
106 -
 107
107 -
 108
108 -
 109
109 -
 110
110 -
111
-
112
-
113
-
114
-
115
-
116
-
117
-
118
-
119
-
120
-
121
-
122
-
123
-
124
-
125
-
126
-
127
-
128
-
129
-
130
-
131
-
132
-
133
-
134
-
135
-
136
-
137
-
138
-
139
-
140
-
141
-
142
-
143
-
144
-
145
-
146
-
147
-
148
-
149
-
150
-
151
-
152
-
153
-
154
-
155
-
156
-
157
-
158
-
159
-
160
-
161
-
162
-
163
-
164
-
165
-
166
-
167
-
168
-
169
-
170
-
171
-
172
-
173
-
174
-
175
-
176
-
177
-
178
-
179
-
180
-
181
-
182
-
183
-
184
-
185
-
186
-
187
-
188
-
189
-
190
-
191
-
192
-
193
-
194
-
195
-
196
-
197
-
198
-
199
-
200
-
201
-
202
-
203
-
204
-
205
-
206
-
207
-
208
-
209
-
210
-
211
-
212
-
213
-
214
-
215
-
216
-
217
-
218
-
219
-
220
-
221
-
222
-
223
-
224
-
225
-
226
-
227
-
228
-
229
-
230
-
231
-
232
-
233
-
234
-
235
-
236
-
237
-
238
-
239
-
240
-
241
-
242
-
243
-
244
-
245
-
246
-
247
-
248
-
249
-
250
-
251
-
252
-
253
-
254
 |
 |
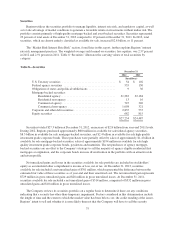
Allowance for Credit Losses
The allowance for credit losses represents management’s estimate of credit losses inherent in the loan and
credit commitment portfolios as of period-end. The allowance for credit losses consists of two components: the
allowance for loan and lease losses and the reserve for unfunded credit commitments. Management’s assessment
of the appropriateness of the allowance for credit losses is based on a combination of both of these components.
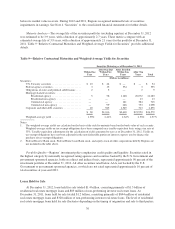
Regions determines its allowance for credit losses in accordance with applicable accounting literature as well as
regulatory guidance related to receivables and contingencies. Binding unfunded credit commitments include
items such as letters of credit, financial guarantees and binding unfunded loan commitments. Additional
discussion of the methodology used to calculate the allowance for credit losses is included in Note 6 “Allowance
for Credit Losses” to the consolidated financial statements, as well as related discussion in Management’s
Discussion and Analysis.
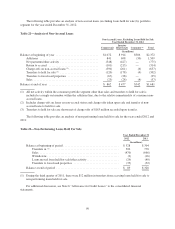
The allowance for loan losses totaled $1.9 billion at December 31, 2012 and $2.7 billion at
December 31, 2011. The allowance for loan losses as a percentage of net loans was 2.59 percent at
December 31, 2012 and 3.54 percent on December 31, 2011. The reserve for unfunded credit commitments was
$83 million at December 31, 2012 compared to $78 million at December 31, 2011. Net charge-offs as a
percentage of average loans were 1.37 percent and 2.44 percent in 2012 and 2011, respectively. Net charge-offs
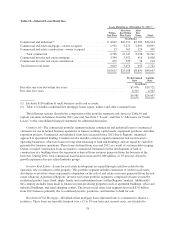
were lower across most categories, period over period, particularly in the case of commercial investor real estate
mortgage as a result of the recent ongoing portfolio derisking and fundamental improvement in credit
performance. Net charge-offs increased period over period for the consumer credit card portfolio, which was
purchased during the second quarter of 2011. In addition to lower levels of charge-offs, credit quality metrics
have improved during 2012 compared to 2011, including lower levels of non-accrual, criticized and classified
loans, and lower inflows of non-accrual loans. The provision for loan losses totaled $213 million for the year
ended 2012 compared to $1.5 billion for the year ended 2011. Net charge-offs exceeded the provision for loan
losses for 2012, primarily resulting from the continued improving credit metrics referred to above, as well as, an
overall reduction in loan balances, problem loan resolutions and a continuing mix shift in loans out of higher risk
investor real estate and into less risky commercial and industrial loans.
Management considers the current level of allowance for credit losses appropriate to absorb losses inherent
in the loan portfolio and unfunded commitments. Management’s determination of the appropriateness of the
allowance for credit losses requires the use of judgments and estimations that may change in the future. Changes
in the factors used by management to determine the appropriateness of the allowance or the availability of new
information could cause the allowance for credit losses to be increased or decreased in future periods. In
addition, bank regulatory agencies, as part of their examination process, may require changes in the level of the
allowance based on their judgments and estimates.
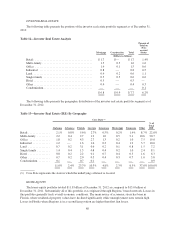
Given continued economic pressures and the anticipated slow economic recovery, management expects that
net loan charge-offs in 2013 will continue to improve compared to 2012. Economic trends such as real estate
valuations, interest rates and unemployment will impact the future levels of net charge-offs and provision and
may result in volatility from quarter to quarter during 2013. Additionally, changes in circumstances related to
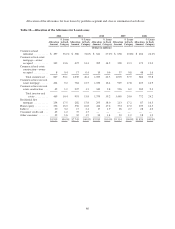
individually large credits or certain portfolios may result in volatility. Details regarding the allowance and net
charge-offs, including an analysis of activity from the previous year’s totals, are included in Table 17
“Allowance for Credit Losses.”
84