Regions Bank 2012 Annual Report Download - page 195
Download and view the complete annual report
Please find page 195 of the 2012 Regions Bank annual report below. You can navigate through the pages in the report by either clicking on the pages listed below, or by using the keyword search tool below to find specific information within the annual report.-
 1
1 -
2
-
3
-
4
-
5
-
6
-
7
-
8
-
9
-
10
-
11
-
12
-
13
-
14
-
15
-
16
-
17
-
18
-
19
-
20
-
21
-
22
-
23
-
24
-
25
-
26
-
27
-
28
-
29
-
30
-
31
-
32
-
33
-
34
-
35
-
36
-
37
-
38
-
39
-
40
-
41
-
42
-
43
-
44
-
45
-
46
-
47
-
48
-
49
-
50
-
51
-
52
-
53
-
54
-
55
-
56
-
57
-
58
-
59
-
60
-
61
-
62
-
63
-
64
-
65
-
66
-
67
-
68
-
69
-
70
-
71
-
72
-
73
-
74
-
75
-
76
-
77
-
78
-
79
-
80
-
81
-
82
-
83
-
84
-
85
-
86
-
87
-
88
-
89
-
90
-
91
-
92
-
93
-
94
-
95
-
96
-
97
-
98
-
99
-
100
-
101
-
102
-
103
-
104
-
105
-
106
-
107
-
108
-
109
-
110
-
111
-
112
-
113
-
114
-
115
-
116
-
117
-
118
-
119
-
120
-
121
-
122
-
123
-
124
-
125
-
126
-
127
-
128
-
129
-
130
-
131
-
132
-
133
-
134
-
135
-
136
-
137
-
138
-
139
-
140
-
141
-
142
-
143
-
144
-
145
-
146
-
147
-
148
-
149
-
150
-
151
-
152
-
153
-
154
-
155
-
156
-
157
-
158
-
159
-
160
-
161
-
162
-
163
-
164
-
165
-
166
-
167
-
168
-
169
-
170
-
171
-
172
-
173
-
174
-
175
-
176
-
177
-
178
-
179
-
180
-
181
-
182
-
183
-
184
-
 185
185 -
 186
186 -
 187
187 -
 188
188 -
 189
189 -
 190
190 -
 191
191 -
 192
192 -
 193
193 -
 194
194 -
 195
195 -
 196
196 -
 197
197 -
 198
198 -
 199
199 -
 200
200 -
 201
201 -
 202
202 -
 203
203 -
 204
204 -
 205
205 -
206
-
207
-
208
-
209
-
210
-
211
-
212
-
213
-
214
-
215
-
216
-
217
-
218
-
219
-
220
-
221
-
222
-
223
-
224
-
225
-
226
-
227
-
228
-
229
-
230
-
231
-
232
-
233
-
234
-
235
-
236
-
237
-
238
-
239
-
240
-
241
-
242
-
243
-
244
-
245
-
246
-
247
-
248
-
249
-
250
-
251
-
252
-
253
-
254
 |
 |

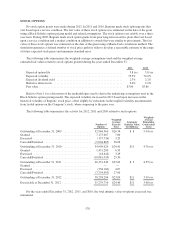
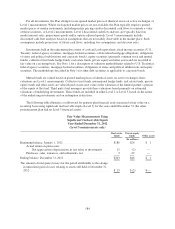
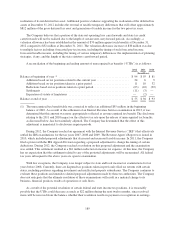
RESTRICTED STOCK AWARDS AND PERFORMANCE STOCK AWARDS
During 2012, 2011 and 2010, Regions made restricted stock grants that vest based upon a service condition.
During 2012, the Company also made restricted stock unit and performance stock unit grants; restricted stock
units vest based upon a service condition and performance stock units vest based upon service and performance
conditions. Dividend payments during the vesting period are deferred to the end of the vesting term. The fair
value of these restricted shares, restricted stock units, and performance stock units was estimated based upon the
fair value of the underlying shares on the date of the grant. The valuation was not adjusted for the deferral of
dividends.
Activity related to restricted stock awards and performance stock awards for 2012, 2011 and 2010 is
summarized as follows:
Number of
Shares
Weighted-Average
Grant Date
Fair Value
Non-vested at December 31, 2009...................................... 5,964,594 $17.15
Granted .......................................................... 1,166,968 6.96
Vested ........................................................... (936,412) 34.00
Forfeited .......................................................... (1,264,706) 15.97
Non-vested at December 31, 2010...................................... 4,930,444 $12.13
Granted .......................................................... 2,705,834 6.66
Vested ........................................................... (1,206,373) 23.36
Forfeited .......................................................... (149,545) 12.93
Non-vested at December 31, 2011...................................... 6,280,360 $ 7.60
Granted .......................................................... 8,461,987 5.86
Vested ........................................................... (2,047,900) 10.12
Forfeited .......................................................... (749,268) 4.22
Non-vested at December 31, 2012...................................... 11,945,179 $ 6.15
As of December 31, 2012, the pre-tax amount of non-vested stock options, restricted stock, restricted stock
units and performance stock units not yet recognized was $39 million, which will be recognized over a weighted-
average period of 1.4 years. No share-based compensation costs were capitalized during the years ended
December 31, 2012, 2011 and 2010.
Regions issued approximately 259 thousand, 867 thousand, and 799 thousand of cash-settled restricted stock
units during 2012, 2011, and 2010, respectively.
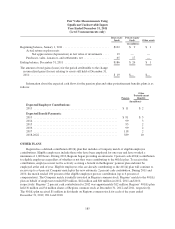
NOTE 17. EMPLOYEE BENEFIT PLANS
PENSION AND OTHER POSTRETIREMENT BENEFIT PLANS
Regions has a defined-benefit pension plan (the “pension plan”) covering only certain employees as the
pension plan is closed to new entrants. Benefits under the pension plan are based on years of service and the
employee’s highest five years of compensation during the last ten years of employment. Regions’ funding policy
is to contribute annually at least the amount required by Internal Revenue Service minimum funding standards.
Contributions are intended to provide not only for benefits attributed to service to date, but also for those
expected to be earned in the future. The Company also sponsors a supplemental executive retirement program
(the “SERP”), which is a non-qualified plan that provides certain senior executive officers defined benefits in
relation to their compensation. Regions also sponsors defined-benefit postretirement health care plans that cover
certain retired employees. For these certain employees retiring before normal retirement age, the Company
currently pays a portion of the costs of certain health care benefits until the retired employee becomes eligible for
179