Regions Bank 2012 Annual Report Download - page 131
Download and view the complete annual report
Please find page 131 of the 2012 Regions Bank annual report below. You can navigate through the pages in the report by either clicking on the pages listed below, or by using the keyword search tool below to find specific information within the annual report.-
 1
1 -
2
-
3
-
4
-
5
-
6
-
7
-
8
-
9
-
10
-
11
-
12
-
13
-
14
-
15
-
16
-
17
-
18
-
19
-
20
-
21
-
22
-
23
-
24
-
25
-
26
-
27
-
28
-
29
-
30
-
31
-
32
-
33
-
34
-
35
-
36
-
37
-
38
-
39
-
40
-
41
-
42
-
43
-
44
-
45
-
46
-
47
-
48
-
49
-
50
-
51
-
52
-
53
-
54
-
55
-
56
-
57
-
58
-
59
-
60
-
61
-
62
-
63
-
64
-
65
-
66
-
67
-
68
-
69
-
70
-
71
-
72
-
73
-
74
-
75
-
76
-
77
-
78
-
79
-
80
-
81
-
82
-
83
-
84
-
85
-
86
-
87
-
88
-
89
-
90
-
91
-
92
-
93
-
94
-
95
-
96
-
97
-
98
-
99
-
100
-
101
-
102
-
103
-
104
-
105
-
106
-
107
-
108
-
109
-
110
-
111
-
112
-
113
-
114
-
115
-
116
-
117
-
118
-
119
-
120
-
 121
121 -
 122
122 -
 123
123 -
 124
124 -
 125
125 -
 126
126 -
 127
127 -
 128
128 -
 129
129 -
 130
130 -
 131
131 -
 132
132 -
 133
133 -
 134
134 -
 135
135 -
 136
136 -
 137
137 -
 138
138 -
 139
139 -
 140
140 -
 141
141 -
142
-
143
-
144
-
145
-
146
-
147
-
148
-
149
-
150
-
151
-
152
-
153
-
154
-
155
-
156
-
157
-
158
-
159
-
160
-
161
-
162
-
163
-
164
-
165
-
166
-
167
-
168
-
169
-
170
-
171
-
172
-
173
-
174
-
175
-
176
-
177
-
178
-
179
-
180
-
181
-
182
-
183
-
184
-
185
-
186
-
187
-
188
-
189
-
190
-
191
-
192
-
193
-
194
-
195
-
196
-
197
-
198
-
199
-
200
-
201
-
202
-
203
-
204
-
205
-
206
-
207
-
208
-
209
-
210
-
211
-
212
-
213
-
214
-
215
-
216
-
217
-
218
-
219
-
220
-
221
-
222
-
223
-
224
-
225
-
226
-
227
-
228
-
229
-
230
-
231
-
232
-
233
-
234
-
235
-
236
-
237
-
238
-
239
-
240
-
241
-
242
-
243
-
244
-
245
-
246
-
247
-
248
-
249
-
250
-
251
-
252
-
253
-
254
 |
 |

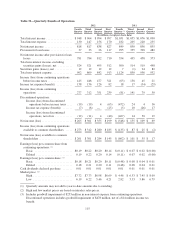
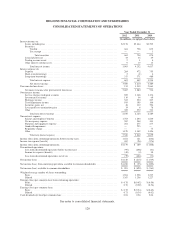
Table 31—Quarterly Results of Operations
2012 2011
Fourth
Quarter
Third
Quarter
Second
Quarter
First
Quarter
Fourth
Quarter (3)
Third
Quarter
Second
Quarter
First
Quarter
(In millions, except per share data)
Total interest income .................. $948 $964 $994 $997 $1,031 $1,055 $1,076 $1,090
Total interest expense ................. 130 147 156 170 182 205 220 235
Net interest income ................... 818 817 838 827 849 850 856 855
Provision for loan losses ............... 37 33 26 117 295 355 398 482
Net interest income after provision for loan
losses ............................ 781 784 812 710 554 495 458 373
Total non-interest income, excluding
securities gains (losses), net .......... 524 521 495 512 500 514 519 498
Securities gains (losses), net ............ 12 12 12 12 7 (1) 24 82
Total non-interest expense .............. 902 869 842 913 1,124 850 956 932
Income (loss) from continuing operations
before income taxes ................. 415 448 477 321 (63) 158 45 21
Income tax expense (benefit) ........... 138 136 126 82 18 17 (34) (29)
Income (loss) from continuing
operations ........................ 277 312 351 239 (81) 141 79 50
Discontinued operations:
Income (loss) from discontinued
operations before income taxes .... (19) (19) 4 (65) (472) 24 4 36
Income tax expense (benefit) ....... (7) (8) — (25) (5) 10 (26) 17
Income (loss) from discontinued
operations, net of tax ............ (12) (11) 4 (40) (467) 14 30 19
Net income (loss) ..................... $265 $301 $355 $199 $ (548) $ 155 $ 109 $ 69
Income (loss) from continuing operations
available to common shareholders ..... $273 $312 $280 $185 $ (135) $ 87 $ 25 $ (2)
Net income (loss) available to common
shareholders ....................... $261 $301 $284 $145 $ (602) $ 101 $ 55 $ 17
Earnings (loss) per common share from
continuing operations: (1)
Basic .......................... $0.19 $0.22 $0.20 $0.14 $ (0.11) $ 0.07 $ 0.02 $ (0.00)
Diluted ......................... 0.19 0.22 0.20 0.14 (0.11) 0.07 0.02 (0.00)
Earnings (loss) per common share: (1)
Basic .......................... $0.18 $0.21 $0.20 $0.11 $ (0.48) $ 0.08 $ 0.04 $ 0.01
Diluted ......................... 0.18 0.21 0.20 0.11 (0.48) 0.08 0.04 0.01
Cash dividends declared per share ....... 0.01 0.01 0.01 0.01 0.01 0.01 0.01 0.01
Market price: (2)
High ........................... $7.72 $7.73 $6.98 $6.69 $ 4.46 $ 6.53 $ 7.45 $ 8.09
Low ........................... 6.19 6.22 5.46 4.21 2.82 3.33 5.86 6.79
(1) Quarterly amounts may not add to year-to-date amounts due to rounding.
(2) High and low market prices are based on intraday sales prices.
(3) Includes goodwill impairment of $253 million in non-interest expense from continuing operations.
Discontinued operations includes goodwill impairment of $478 million, net of a $14 million income tax
benefit.
115