Regions Bank 2012 Annual Report Download - page 179
Download and view the complete annual report
Please find page 179 of the 2012 Regions Bank annual report below. You can navigate through the pages in the report by either clicking on the pages listed below, or by using the keyword search tool below to find specific information within the annual report.-
 1
1 -
2
-
3
-
4
-
5
-
6
-
7
-
8
-
9
-
10
-
11
-
12
-
13
-
14
-
15
-
16
-
17
-
18
-
19
-
20
-
21
-
22
-
23
-
24
-
25
-
26
-
27
-
28
-
29
-
30
-
31
-
32
-
33
-
34
-
35
-
36
-
37
-
38
-
39
-
40
-
41
-
42
-
43
-
44
-
45
-
46
-
47
-
48
-
49
-
50
-
51
-
52
-
53
-
54
-
55
-
56
-
57
-
58
-
59
-
60
-
61
-
62
-
63
-
64
-
65
-
66
-
67
-
68
-
69
-
70
-
71
-
72
-
73
-
74
-
75
-
76
-
77
-
78
-
79
-
80
-
81
-
82
-
83
-
84
-
85
-
86
-
87
-
88
-
89
-
90
-
91
-
92
-
93
-
94
-
95
-
96
-
97
-
98
-
99
-
100
-
101
-
102
-
103
-
104
-
105
-
106
-
107
-
108
-
109
-
110
-
111
-
112
-
113
-
114
-
115
-
116
-
117
-
118
-
119
-
120
-
121
-
122
-
123
-
124
-
125
-
126
-
127
-
128
-
129
-
130
-
131
-
132
-
133
-
134
-
135
-
136
-
137
-
138
-
139
-
140
-
141
-
142
-
143
-
144
-
145
-
146
-
147
-
148
-
149
-
150
-
151
-
152
-
153
-
154
-
155
-
156
-
157
-
158
-
159
-
160
-
161
-
162
-
163
-
164
-
165
-
166
-
167
-
168
-
 169
169 -
 170
170 -
 171
171 -
 172
172 -
 173
173 -
 174
174 -
 175
175 -
 176
176 -
 177
177 -
 178
178 -
 179
179 -
 180
180 -
 181
181 -
 182
182 -
 183
183 -
 184
184 -
 185
185 -
 186
186 -
 187
187 -
 188
188 -
 189
189 -
190
-
191
-
192
-
193
-
194
-
195
-
196
-
197
-
198
-
199
-
200
-
201
-
202
-
203
-
204
-
205
-
206
-
207
-
208
-
209
-
210
-
211
-
212
-
213
-
214
-
215
-
216
-
217
-
218
-
219
-
220
-
221
-
222
-
223
-
224
-
225
-
226
-
227
-
228
-
229
-
230
-
231
-
232
-
233
-
234
-
235
-
236
-
237
-
238
-
239
-
240
-
241
-
242
-
243
-
244
-
245
-
246
-
247
-
248
-
249
-
250
-
251
-
252
-
253
-
254
 |
 |

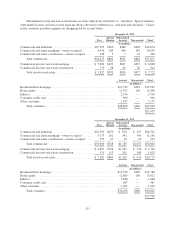
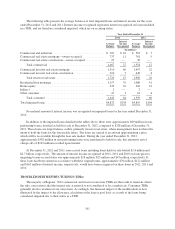
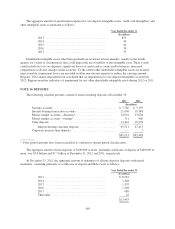
As described previously, the consumer modifications granted by Regions are rate concessions and not
forgiveness of principal. The majority of the commercial and investor real estate modifications are renewals
where there is no reduction in interest rate or forgiveness of principal. Accordingly, Regions most often does not
record a charge-off at the modification date. A limited number of modifications included above are A/B note
restructurings, where the B-note is charged off. The total charge-offs recorded for all modifications for the year
ended December 31, 2012 were approximately $5 million.
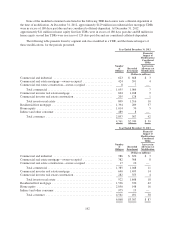
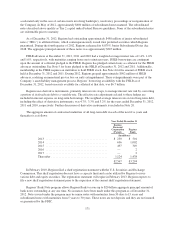
Defaulted TDRs
The following table presents TDRs which defaulted during the years ended December 31, 2012 and 2011,
and which were modified in the previous twelve months (i.e., the twelve months prior to the default). For
purposes of this disclosure, default is defined as 90 days past due and still accruing for the consumer portfolio
segment, and placement on non-accrual status for the commercial and investor real estate portfolio segments.
Consideration of defaults in the calculation of the allowance for loan losses is described previously in the
description of modifications in each portfolio segment.
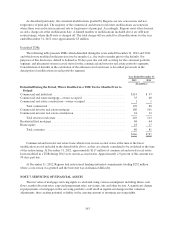
Year Ended December 31
2012 2011
(In millions)
Defaulted During the Period, Where Modified in a TDR Twelve Months Prior to
Default
Commercial and industrial ................................................. $114 $ 47
Commercial real estate mortgage—owner-occupied ............................. 55 40
Commercial real estate construction—owner-occupied ........................... 1 1
Total commercial ..................................................... 170 88
Commercial investor real estate mortgage ..................................... 186 101
Commercial investor real estate construction ................................... 24 12
Total investor real estate ............................................... 210 113
Residential first mortgage .................................................. 68 64
Home equity ............................................................ 18 17
Total consumer ...................................................... 86 81
$466 $282
Commercial and investor real estate loans which were on non-accrual status at the time of the latest
modification are not included in the default table above, as they are already considered to be in default at the time
of the restructuring. At December 31, 2012, approximately $117 million of commercial and investor real estate
loans modified in a TDR during 2012 were on non-accrual status. Approximately 2.9 percent of this amount was
90 days past due.
At December 31, 2012, Regions had restructured binding unfunded commitments totaling $252 million
where a concession was granted and the borrower was in financial difficulty.
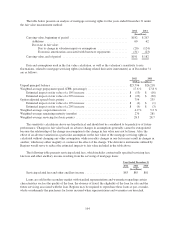
NOTE 7. SERVICING OF FINANCIAL ASSETS
The fair value of mortgage servicing rights is calculated using various assumptions including future cash
flows, market discount rates, expected prepayment rates, servicing costs and other factors. A significant change
in prepayments of mortgages in the servicing portfolio could result in significant changes in the valuation
adjustments, thus creating potential volatility in the carrying amount of mortgage servicing rights.
163