Regions Bank 2012 Annual Report Download - page 98
Download and view the complete annual report
Please find page 98 of the 2012 Regions Bank annual report below. You can navigate through the pages in the report by either clicking on the pages listed below, or by using the keyword search tool below to find specific information within the annual report.-
 1
1 -
2
-
3
-
4
-
5
-
6
-
7
-
8
-
9
-
10
-
11
-
12
-
13
-
14
-
15
-
16
-
17
-
18
-
19
-
20
-
21
-
22
-
23
-
24
-
25
-
26
-
27
-
28
-
29
-
30
-
31
-
32
-
33
-
34
-
35
-
36
-
37
-
38
-
39
-
40
-
41
-
42
-
43
-
44
-
45
-
46
-
47
-
48
-
49
-
50
-
51
-
52
-
53
-
54
-
55
-
56
-
57
-
58
-
59
-
60
-
61
-
62
-
63
-
64
-
65
-
66
-
67
-
68
-
69
-
70
-
71
-
72
-
73
-
74
-
75
-
76
-
77
-
78
-
79
-
80
-
81
-
82
-
83
-
84
-
85
-
86
-
87
-
 88
88 -
 89
89 -
 90
90 -
 91
91 -
 92
92 -
 93
93 -
 94
94 -
 95
95 -
 96
96 -
 97
97 -
 98
98 -
 99
99 -
 100
100 -
 101
101 -
 102
102 -
 103
103 -
 104
104 -
 105
105 -
 106
106 -
 107
107 -
 108
108 -
109
-
110
-
111
-
112
-
113
-
114
-
115
-
116
-
117
-
118
-
119
-
120
-
121
-
122
-
123
-
124
-
125
-
126
-
127
-
128
-
129
-
130
-
131
-
132
-
133
-
134
-
135
-
136
-
137
-
138
-
139
-
140
-
141
-
142
-
143
-
144
-
145
-
146
-
147
-
148
-
149
-
150
-
151
-
152
-
153
-
154
-
155
-
156
-
157
-
158
-
159
-
160
-
161
-
162
-
163
-
164
-
165
-
166
-
167
-
168
-
169
-
170
-
171
-
172
-
173
-
174
-
175
-
176
-
177
-
178
-
179
-
180
-
181
-
182
-
183
-
184
-
185
-
186
-
187
-
188
-
189
-
190
-
191
-
192
-
193
-
194
-
195
-
196
-
197
-
198
-
199
-
200
-
201
-
202
-
203
-
204
-
205
-
206
-
207
-
208
-
209
-
210
-
211
-
212
-
213
-
214
-
215
-
216
-
217
-
218
-
219
-
220
-
221
-
222
-
223
-
224
-
225
-
226
-
227
-
228
-
229
-
230
-
231
-
232
-
233
-
234
-
235
-
236
-
237
-
238
-
239
-
240
-
241
-
242
-
243
-
244
-
245
-
246
-
247
-
248
-
249
-
250
-
251
-
252
-
253
-
254
 |
 |
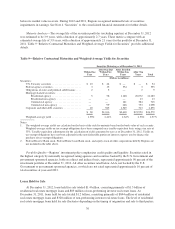
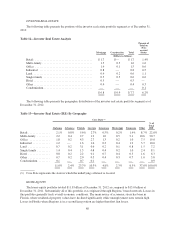
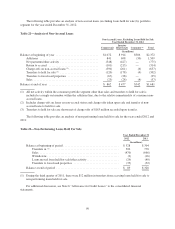
Regions’ home equity loans have higher default and delinquency rates than home equity lines of credit,
which is expected at origination of the loans, due to more stringent underwriting guidelines for a line of credit
versus a loan reflecting the nature of the credit being extended. Therefore, home equity loans secured with a
second lien are expected to and do have higher delinquency and loss rates than home equity lines of credit with a
second lien. In the current environment, second liens in areas experiencing declines in home prices since
origination, such as Florida, perform similar to an unsecured portfolio.
Regions is unable to track payment status on first liens held by another institution, including payment status
related to loan modifications. When Regions’ second lien position becomes delinquent, an attempt is made to
contact the first lien holder and inquire as to the payment status of the first lien. However, Regions does not
continuously monitor the payment status of the first lien position. Short sale offers and settlement agreements are
often received by the home equity junior lien holders well before the loan balance reaches the delinquency
threshold for charge-off consideration, potentially resulting in a full balance payoff/charge-off. Regions is
presently monitoring the status of all first lien position loans that the Company owns or services and has a second
lien, and is taking appropriate action when delinquent. During 2012, Regions evaluated a means to monitor non-
Regions-serviced first liens using a third-party service provider and found that the delinquency rates were not
material.
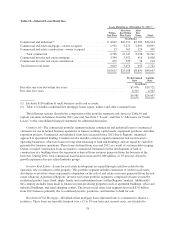
OTHER CONSUMER CREDIT QUALITY DATA
The Company calculates an estimate of the current value of property secured as collateral for both home
equity and residential first mortgage lending products (“current LTV”). The estimate is based on home price
indices compiled by the Federal Housing Finance Agency (“FHFA”). The FHFA data indicates trends for
Metropolitan Statistical Areas (“MSAs”). Regions uses the FHFA valuation trends from the MSAs in the
Company’s footprint in its estimate. The trend data is applied to the loan portfolios taking into account the age of
the most recent valuation and geographic area.
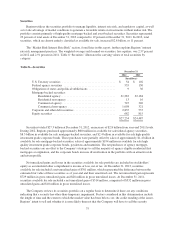
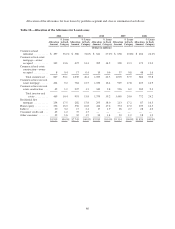
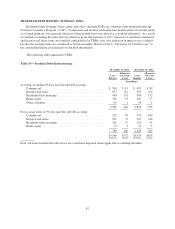
The following table presents current LTV data for components of the residential mortgage and home equity
classes of the consumer portfolio segment. Current LTV data for the remaining loans in the portfolio is not
available, primarily because some of the loans are serviced by others. Data may also not be available due to
mergers and systems integrations. The amounts in the table represent the entire loan balance. For purposes of the
table below, if the loan balance exceeds the current estimated collateral, the entire balance is included in the
“Above 100%” category, regardless of the amount of collateral available to partially offset the shortfall. The
balances in the “Above 100%” category as a percentage of the portfolio balances have remained constant at 13%
for residential first mortgage and 17% for home equity portfolios as of December 31, 2012 and 2011,
respectively.
82