Regions Bank 2012 Annual Report Download - page 137
Download and view the complete annual report
Please find page 137 of the 2012 Regions Bank annual report below. You can navigate through the pages in the report by either clicking on the pages listed below, or by using the keyword search tool below to find specific information within the annual report.-
 1
1 -
2
-
3
-
4
-
5
-
6
-
7
-
8
-
9
-
10
-
11
-
12
-
13
-
14
-
15
-
16
-
17
-
18
-
19
-
20
-
21
-
22
-
23
-
24
-
25
-
26
-
27
-
28
-
29
-
30
-
31
-
32
-
33
-
34
-
35
-
36
-
37
-
38
-
39
-
40
-
41
-
42
-
43
-
44
-
45
-
46
-
47
-
48
-
49
-
50
-
51
-
52
-
53
-
54
-
55
-
56
-
57
-
58
-
59
-
60
-
61
-
62
-
63
-
64
-
65
-
66
-
67
-
68
-
69
-
70
-
71
-
72
-
73
-
74
-
75
-
76
-
77
-
78
-
79
-
80
-
81
-
82
-
83
-
84
-
85
-
86
-
87
-
88
-
89
-
90
-
91
-
92
-
93
-
94
-
95
-
96
-
97
-
98
-
99
-
100
-
101
-
102
-
103
-
104
-
105
-
106
-
107
-
108
-
109
-
110
-
111
-
112
-
113
-
114
-
115
-
116
-
117
-
118
-
119
-
120
-
121
-
122
-
123
-
124
-
125
-
126
-
 127
127 -
 128
128 -
 129
129 -
 130
130 -
 131
131 -
 132
132 -
 133
133 -
 134
134 -
 135
135 -
 136
136 -
 137
137 -
 138
138 -
 139
139 -
 140
140 -
 141
141 -
 142
142 -
 143
143 -
 144
144 -
 145
145 -
 146
146 -
 147
147 -
148
-
149
-
150
-
151
-
152
-
153
-
154
-
155
-
156
-
157
-
158
-
159
-
160
-
161
-
162
-
163
-
164
-
165
-
166
-
167
-
168
-
169
-
170
-
171
-
172
-
173
-
174
-
175
-
176
-
177
-
178
-
179
-
180
-
181
-
182
-
183
-
184
-
185
-
186
-
187
-
188
-
189
-
190
-
191
-
192
-
193
-
194
-
195
-
196
-
197
-
198
-
199
-
200
-
201
-
202
-
203
-
204
-
205
-
206
-
207
-
208
-
209
-
210
-
211
-
212
-
213
-
214
-
215
-
216
-
217
-
218
-
219
-
220
-
221
-
222
-
223
-
224
-
225
-
226
-
227
-
228
-
229
-
230
-
231
-
232
-
233
-
234
-
235
-
236
-
237
-
238
-
239
-
240
-
241
-
242
-
243
-
244
-
245
-
246
-
247
-
248
-
249
-
250
-
251
-
252
-
253
-
254
 |
 |

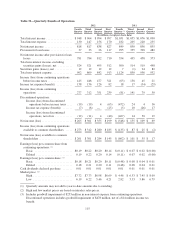
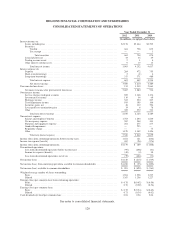
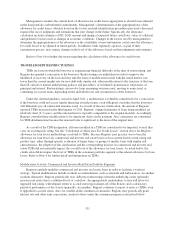
REGIONS FINANCIAL CORPORATION AND SUBSIDIARIES
CONSOLIDATED STATEMENTS OF COMPREHENSIVE INCOME (LOSS)
Year Ended December 31
2012 2011 2010
(In millions)
Net income (loss) ........................................................ $1,120 $(215) $(539)
Other comprehensive income (loss), net of tax:*
Unrealized gains (losses) on securities available for sale:
Unrealized holding gains arising during the period (net of ($90), ($189)
and ($21) tax effect, respectively) ............................. 145 317 62
Less: reclassification adjustments for securities gains realized in net
income (loss) (net of ($17), ($39) and ($138) tax effect,
respectively) .............................................. 31 73 256
Net change in unrealized gain (loss) on securities available for sale, net
oftax ................................................... 114 244 (194)
Unrealized gains (losses) on derivative instruments:
Unrealized holding gains (losses) on derivatives arising during the
period (net of ($31), ($123) and $3 tax effect, respectively) ......... 51 202 (6)
Less: reclassification adjustments for gains realized in net income (loss)
(net of ($25), ($66) and ($99) tax effect, respectively) ............. 42 108 160
Net change in unrealized gain (loss) on derivative instruments, net of
tax ..................................................... 9 94 (166)
Defined benefit pension plans and other post employment benefits:
Net actuarial gains and losses arising during the period (net of $20, $74
and $4 tax effect, respectively) ............................... (38) (118) (1)
Amortization of actuarial loss and prior service cost realized in net
income (loss), and other (net of $26, ($16) and ($15) tax effect,
respectively) .............................................. (49) 29 29
Net change from defined benefit pension plans .................... 11 (147) (30)
Other comprehensive income (loss), net of tax* ................................ $ 134 $191 $(390)
Comprehensive income (loss) .............................................. $1,254 $ (24) $(929)
* All other comprehensive amounts are shown net of tax.
See notes to consolidated financial statements.
121