Regions Bank 2012 Annual Report Download - page 203
Download and view the complete annual report
Please find page 203 of the 2012 Regions Bank annual report below. You can navigate through the pages in the report by either clicking on the pages listed below, or by using the keyword search tool below to find specific information within the annual report.-
 1
1 -
2
-
3
-
4
-
5
-
6
-
7
-
8
-
9
-
10
-
11
-
12
-
13
-
14
-
15
-
16
-
17
-
18
-
19
-
20
-
21
-
22
-
23
-
24
-
25
-
26
-
27
-
28
-
29
-
30
-
31
-
32
-
33
-
34
-
35
-
36
-
37
-
38
-
39
-
40
-
41
-
42
-
43
-
44
-
45
-
46
-
47
-
48
-
49
-
50
-
51
-
52
-
53
-
54
-
55
-
56
-
57
-
58
-
59
-
60
-
61
-
62
-
63
-
64
-
65
-
66
-
67
-
68
-
69
-
70
-
71
-
72
-
73
-
74
-
75
-
76
-
77
-
78
-
79
-
80
-
81
-
82
-
83
-
84
-
85
-
86
-
87
-
88
-
89
-
90
-
91
-
92
-
93
-
94
-
95
-
96
-
97
-
98
-
99
-
100
-
101
-
102
-
103
-
104
-
105
-
106
-
107
-
108
-
109
-
110
-
111
-
112
-
113
-
114
-
115
-
116
-
117
-
118
-
119
-
120
-
121
-
122
-
123
-
124
-
125
-
126
-
127
-
128
-
129
-
130
-
131
-
132
-
133
-
134
-
135
-
136
-
137
-
138
-
139
-
140
-
141
-
142
-
143
-
144
-
145
-
146
-
147
-
148
-
149
-
150
-
151
-
152
-
153
-
154
-
155
-
156
-
157
-
158
-
159
-
160
-
161
-
162
-
163
-
164
-
165
-
166
-
167
-
168
-
169
-
170
-
171
-
172
-
173
-
174
-
175
-
176
-
177
-
178
-
179
-
180
-
181
-
182
-
183
-
184
-
185
-
186
-
187
-
188
-
189
-
190
-
191
-
192
-
 193
193 -
 194
194 -
 195
195 -
 196
196 -
 197
197 -
 198
198 -
 199
199 -
 200
200 -
 201
201 -
 202
202 -
 203
203 -
 204
204 -
 205
205 -
 206
206 -
 207
207 -
 208
208 -
 209
209 -
 210
210 -
 211
211 -
 212
212 -
 213
213 -
214
-
215
-
216
-
217
-
218
-
219
-
220
-
221
-
222
-
223
-
224
-
225
-
226
-
227
-
228
-
229
-
230
-
231
-
232
-
233
-
234
-
235
-
236
-
237
-
238
-
239
-
240
-
241
-
242
-
243
-
244
-
245
-
246
-
247
-
248
-
249
-
250
-
251
-
252
-
253
-
254
 |
 |

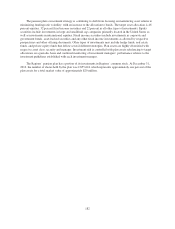
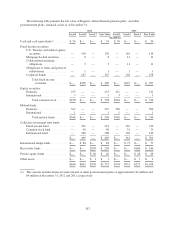
Income tax expense (benefit) does not reflect the tax effects of unrealized gains and losses on securities
available for sale, unrealized gains and losses on derivative instruments and the net change from defined benefit
plans. Refer to Note 14 for additional information on stockholders’ equity and accumulated other comprehensive
income (loss).
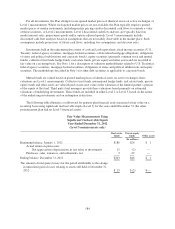
The income tax effects resulting from stock transactions under the Company’s compensation plans were a
decrease to stockholders’ equity of $6 million, $7 million and $11 million in 2012, 2011 and 2010, respectively.
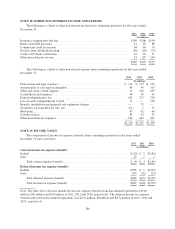
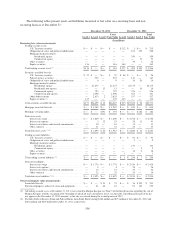
Income taxes from continuing operations for financial reporting purposes differs from the amount computed
by applying the statutory federal income tax rate of 35 percent for the years ended December 31, as shown in the
following table:
2012 2011 2010
(Dollars in millions)
Tax on income (loss) from continuing operations computed at statutory federal income
tax rate .............................................................. $582 $ 56 $(295)
Increase (decrease) in taxes resulting from:
State income tax, net of federal tax effect ................................. 77 (20) (46)
Affordable housing credits and other credits ............................... (108) (107) (102)
Federal audit settlement ............................................... (61) — —
Bank-owned life insurance ............................................. (32) (34) (33)
Tax-exempt income from obligations of states and political subdivisions ........ (29) (21) (21)
Lease financing ..................................................... 24 24 74
Regulatory charge ................................................... — (17) 26
Goodwill impairment ................................................. — 89 —
Other, net .......................................................... 29 2 21
Income tax expense (benefit) ............................................... $482 $ (28) $(376)
Effective tax rate ........................................................ 29.0% (17.4)% 44.5%
Note: The table above relates to income taxes from continuing operations. In 2011, a regulatory settlement was
finalized and a portion was determined to be deductible for income tax purposes. This settlement resulted in a
$27 million income tax benefit to discontinued operations. In addition, the $492 million goodwill impairment
reflected in 2011 discontinued operations resulted in a $14 million income tax benefit. The 2010 regulatory
charge of $125 million reflected in discontinued operations was considered to be non-deductible at the time of
the accrual.
187