Regions Bank 2012 Annual Report Download - page 96
Download and view the complete annual report
Please find page 96 of the 2012 Regions Bank annual report below. You can navigate through the pages in the report by either clicking on the pages listed below, or by using the keyword search tool below to find specific information within the annual report.-
 1
1 -
2
-
3
-
4
-
5
-
6
-
7
-
8
-
9
-
10
-
11
-
12
-
13
-
14
-
15
-
16
-
17
-
18
-
19
-
20
-
21
-
22
-
23
-
24
-
25
-
26
-
27
-
28
-
29
-
30
-
31
-
32
-
33
-
34
-
35
-
36
-
37
-
38
-
39
-
40
-
41
-
42
-
43
-
44
-
45
-
46
-
47
-
48
-
49
-
50
-
51
-
52
-
53
-
54
-
55
-
56
-
57
-
58
-
59
-
60
-
61
-
62
-
63
-
64
-
65
-
66
-
67
-
68
-
69
-
70
-
71
-
72
-
73
-
74
-
75
-
76
-
77
-
78
-
79
-
80
-
81
-
82
-
83
-
84
-
85
-
 86
86 -
 87
87 -
 88
88 -
 89
89 -
 90
90 -
 91
91 -
 92
92 -
 93
93 -
 94
94 -
 95
95 -
 96
96 -
 97
97 -
 98
98 -
 99
99 -
 100
100 -
 101
101 -
 102
102 -
 103
103 -
 104
104 -
 105
105 -
 106
106 -
107
-
108
-
109
-
110
-
111
-
112
-
113
-
114
-
115
-
116
-
117
-
118
-
119
-
120
-
121
-
122
-
123
-
124
-
125
-
126
-
127
-
128
-
129
-
130
-
131
-
132
-
133
-
134
-
135
-
136
-
137
-
138
-
139
-
140
-
141
-
142
-
143
-
144
-
145
-
146
-
147
-
148
-
149
-
150
-
151
-
152
-
153
-
154
-
155
-
156
-
157
-
158
-
159
-
160
-
161
-
162
-
163
-
164
-
165
-
166
-
167
-
168
-
169
-
170
-
171
-
172
-
173
-
174
-
175
-
176
-
177
-
178
-
179
-
180
-
181
-
182
-
183
-
184
-
185
-
186
-
187
-
188
-
189
-
190
-
191
-
192
-
193
-
194
-
195
-
196
-
197
-
198
-
199
-
200
-
201
-
202
-
203
-
204
-
205
-
206
-
207
-
208
-
209
-
210
-
211
-
212
-
213
-
214
-
215
-
216
-
217
-
218
-
219
-
220
-
221
-
222
-
223
-
224
-
225
-
226
-
227
-
228
-
229
-
230
-
231
-
232
-
233
-
234
-
235
-
236
-
237
-
238
-
239
-
240
-
241
-
242
-
243
-
244
-
245
-
246
-
247
-
248
-
249
-
250
-
251
-
252
-
253
-
254
 |
 |

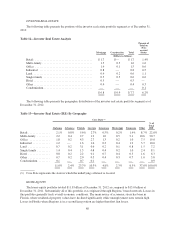
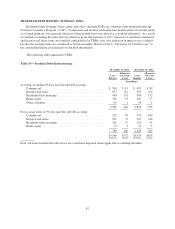
INVESTOR REAL ESTATE
The following table presents the portions of the investor real estate portfolio segment as of December 31,
2012:
Table 12—Investor Real Estate Analysis
Mortgage Construction Total
Percent of
Total on
Non-
accrual
Status
(Dollars in billions)
Retail ....................................... $1.7 $— $1.7 1.4%
Multi-family .................................. 1.3 0.3 1.6 1.6
Office ....................................... 1.4 0.1 1.5 0.6
Industrial .................................... 0.8 — 0.8 0.5
Land ........................................ 0.4 0.2 0.6 1.1
Single family ................................. 0.3 0.3 0.6 0.6
Hotel ........................................ 0.5 — 0.5 —
Other ........................................ 0.4 — 0.4 0.3
Condominium ................................. — — — 0.1
$ 6.8 $ 0.9 $ 7.7 6.2%
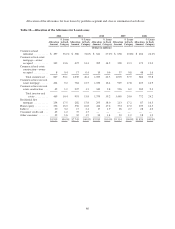
The following table presents the geographic distribution of the investor real estate portfolio segment as of
December 31, 2012:
Table 13—Investor Real Estate (IRE) By Geography
Core State (1)
Alabama Arkansas Florida Georgia Lousisana Mississippi Tennessee Other
%of
Total
IRE
Retail ............... 2.1% 0.8% 5.6% 2.7% 0.5% 0.2% 1.4% 8.7% 22.0%
Multi-family ......... 2.2 0.4 2.7 1.2 1.0 0.5 2.1 10.6 20.7
Office .............. 1.8 0.2 4.3 2.7 1.3 0.2 1.0 7.5 19.0
Industrial ............ 1.2 — 1.6 1.6 0.3 0.4 1.2 3.7 10.0
Land ............... 0.7 0.2 3.1 0.6 0.2 0.1 0.8 1.5 7.2
Single family ......... 1.4 0.4 1.5 0.8 0.4 0.2 1.0 2.4 8.1
Hotel ............... 0.8 0.2 2.2 0.1 0.7 0.4 0.3 1.6 6.3
Other ............... 0.7 0.2 2.0 0.5 0.4 0.3 0.7 1.0 5.8
Condominium ........ 0.1 — 0.7 0.1 — — — — 0.9
11.0% 2.4% 23.7% 10.3% 4.8% 2.3% 8.5% 37.0% 100.0%
(1) Core State represents the state in which the underlying collateral is located.
HOME EQUITY
The home equity portfolio totaled $11.8 billion at December 31, 2012 as compared to $13.0 billion at
December 31, 2011. Substantially all of this portfolio was originated through Regions’ branch network. Losses in
this portfolio generally track overall economic conditions. The main source of economic stress has been in
Florida, where residential property values have declined significantly while unemployment rates remain high.
Losses in Florida where Regions is in a second lien position are higher than first lien losses.
80