Regions Bank 2012 Annual Report Download - page 208
Download and view the complete annual report
Please find page 208 of the 2012 Regions Bank annual report below. You can navigate through the pages in the report by either clicking on the pages listed below, or by using the keyword search tool below to find specific information within the annual report.-
 1
1 -
2
-
3
-
4
-
5
-
6
-
7
-
8
-
9
-
10
-
11
-
12
-
13
-
14
-
15
-
16
-
17
-
18
-
19
-
20
-
21
-
22
-
23
-
24
-
25
-
26
-
27
-
28
-
29
-
30
-
31
-
32
-
33
-
34
-
35
-
36
-
37
-
38
-
39
-
40
-
41
-
42
-
43
-
44
-
45
-
46
-
47
-
48
-
49
-
50
-
51
-
52
-
53
-
54
-
55
-
56
-
57
-
58
-
59
-
60
-
61
-
62
-
63
-
64
-
65
-
66
-
67
-
68
-
69
-
70
-
71
-
72
-
73
-
74
-
75
-
76
-
77
-
78
-
79
-
80
-
81
-
82
-
83
-
84
-
85
-
86
-
87
-
88
-
89
-
90
-
91
-
92
-
93
-
94
-
95
-
96
-
97
-
98
-
99
-
100
-
101
-
102
-
103
-
104
-
105
-
106
-
107
-
108
-
109
-
110
-
111
-
112
-
113
-
114
-
115
-
116
-
117
-
118
-
119
-
120
-
121
-
122
-
123
-
124
-
125
-
126
-
127
-
128
-
129
-
130
-
131
-
132
-
133
-
134
-
135
-
136
-
137
-
138
-
139
-
140
-
141
-
142
-
143
-
144
-
145
-
146
-
147
-
148
-
149
-
150
-
151
-
152
-
153
-
154
-
155
-
156
-
157
-
158
-
159
-
160
-
161
-
162
-
163
-
164
-
165
-
166
-
167
-
168
-
169
-
170
-
171
-
172
-
173
-
174
-
175
-
176
-
177
-
178
-
179
-
180
-
181
-
182
-
183
-
184
-
185
-
186
-
187
-
188
-
189
-
190
-
191
-
192
-
193
-
194
-
195
-
196
-
197
-
 198
198 -
 199
199 -
 200
200 -
 201
201 -
 202
202 -
 203
203 -
 204
204 -
 205
205 -
 206
206 -
 207
207 -
 208
208 -
 209
209 -
 210
210 -
 211
211 -
 212
212 -
 213
213 -
 214
214 -
 215
215 -
 216
216 -
 217
217 -
 218
218 -
219
-
220
-
221
-
222
-
223
-
224
-
225
-
226
-
227
-
228
-
229
-
230
-
231
-
232
-
233
-
234
-
235
-
236
-
237
-
238
-
239
-
240
-
241
-
242
-
243
-
244
-
245
-
246
-
247
-
248
-
249
-
250
-
251
-
252
-
253
-
254
 |
 |

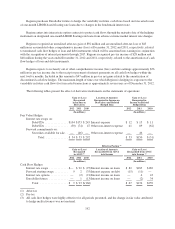
Regions purchases Eurodollar futures to hedge the variability in future cash flows based on forecasted resets
of one-month LIBOR-based floating rate loans due to changes in the benchmark interest rate.
Regions enters into interest rate option contracts to protect cash flows through the maturity date of the hedging
instrument on designated one-month LIBOR floating-rate loans from adverse extreme market interest rate changes.
Regions recognized an unrealized after-tax gain of $92 million and an unrealized after-tax loss of $45
million in accumulated other comprehensive income (loss) at December 31, 2012 and 2011, respectively, related
to terminated cash flow hedges of loan and debt instruments which will be amortized into earnings in conjunction
with the recognition of interest payments through 2017. Regions recognized pre-tax income of $28 million and
$48 million during the years ended December 31, 2012 and 2011, respectively, related to the amortization of cash
flow hedges of loan and debt instruments.
Regions expects to reclassify out of other comprehensive income (loss) and into earnings approximately $56
million in pre-tax income due to the receipt or payment of interest payments on all cash flow hedges within the
next twelve months. Included in this amount is $47 million in pre-tax net gains related to the amortization of
discontinued cash flow hedges. The maximum length of time over which Regions is hedging its exposure to the
variability in future cash flows for forecasted transactions is approximately seven years as of December 31, 2012.
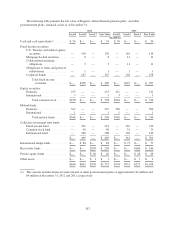
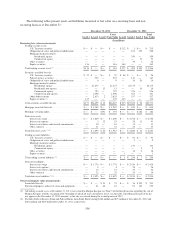
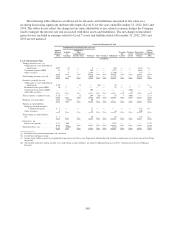
The following tables present the effect of derivative instruments on the statements of operations:
Gain or (Loss)
Recognized
in Income on
Derivatives
Location of Amounts
Recognized in Income on
Derivatives and Related
Hedged Item
Gain or (Loss)
Recognized in
Income on Related
Hedged Item
2012 2011 2010 2012 2011 2010
(In millions) (In millions)
Fair Value Hedges:
Interest rate swaps on:
Debt/CDs ................ $104 $173 $ 245 Interest expense $ 12 $ 15 $ 11
Debt/CDs ................ (50) (74) 47 Other non-interest expense 41 89 (62)
Forward commitments on:
Securities available for sale . . — (46) — Other non-interest expense — 46 —
Total ............... $ 54 $ 53 $292 $ 53 $150 $ (51)
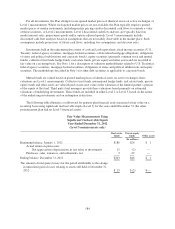
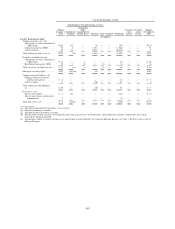
Effective Portion (3)
Gain or (Loss)
Recognized
in AOCI (1)
Location of Amounts
Reclassified from AOCI
into Income
Gain or (Loss)
Reclassified from AOCI
into Income (2)
2012 2011 2010 2012 2011 2010
(In millions) (In millions)
Cash Flow Hedges:
Interest rate swaps ............. $— $ 92 $ (97)Interest income on loans $ 82 $183 $182
Forward starting swaps ......... 9 2 (35)Interest expense on debt (15) (11) —
Interest rate options ............ — (2) (21)Interest income on loans — 4 43
Eurodollar futures ............. — 1 (13)Interest income on loans — (2) 34
Total ................... $ 9 $ 93 $(166) $ 67 $174 $259
(1) After-tax
(2) Pre-tax
(3) All cash flow hedges were highly effective for all periods presented, and the change in fair value attributed
to hedge ineffectiveness was not material.
192