Regions Bank 2012 Annual Report Download - page 87
Download and view the complete annual report
Please find page 87 of the 2012 Regions Bank annual report below. You can navigate through the pages in the report by either clicking on the pages listed below, or by using the keyword search tool below to find specific information within the annual report.-
 1
1 -
2
-
3
-
4
-
5
-
6
-
7
-
8
-
9
-
10
-
11
-
12
-
13
-
14
-
15
-
16
-
17
-
18
-
19
-
20
-
21
-
22
-
23
-
24
-
25
-
26
-
27
-
28
-
29
-
30
-
31
-
32
-
33
-
34
-
35
-
36
-
37
-
38
-
39
-
40
-
41
-
42
-
43
-
44
-
45
-
46
-
47
-
48
-
49
-
50
-
51
-
52
-
53
-
54
-
55
-
56
-
57
-
58
-
59
-
60
-
61
-
62
-
63
-
64
-
65
-
66
-
67
-
68
-
69
-
70
-
71
-
72
-
73
-
74
-
75
-
76
-
 77
77 -
 78
78 -
 79
79 -
 80
80 -
 81
81 -
 82
82 -
 83
83 -
 84
84 -
 85
85 -
 86
86 -
 87
87 -
 88
88 -
 89
89 -
 90
90 -
 91
91 -
 92
92 -
 93
93 -
 94
94 -
 95
95 -
 96
96 -
 97
97 -
98
-
99
-
100
-
101
-
102
-
103
-
104
-
105
-
106
-
107
-
108
-
109
-
110
-
111
-
112
-
113
-
114
-
115
-
116
-
117
-
118
-
119
-
120
-
121
-
122
-
123
-
124
-
125
-
126
-
127
-
128
-
129
-
130
-
131
-
132
-
133
-
134
-
135
-
136
-
137
-
138
-
139
-
140
-
141
-
142
-
143
-
144
-
145
-
146
-
147
-
148
-
149
-
150
-
151
-
152
-
153
-
154
-
155
-
156
-
157
-
158
-
159
-
160
-
161
-
162
-
163
-
164
-
165
-
166
-
167
-
168
-
169
-
170
-
171
-
172
-
173
-
174
-
175
-
176
-
177
-
178
-
179
-
180
-
181
-
182
-
183
-
184
-
185
-
186
-
187
-
188
-
189
-
190
-
191
-
192
-
193
-
194
-
195
-
196
-
197
-
198
-
199
-
200
-
201
-
202
-
203
-
204
-
205
-
206
-
207
-
208
-
209
-
210
-
211
-
212
-
213
-
214
-
215
-
216
-
217
-
218
-
219
-
220
-
221
-
222
-
223
-
224
-
225
-
226
-
227
-
228
-
229
-
230
-
231
-
232
-
233
-
234
-
235
-
236
-
237
-
238
-
239
-
240
-
241
-
242
-
243
-
244
-
245
-
246
-
247
-
248
-
249
-
250
-
251
-
252
-
253
-
254
 |
 |
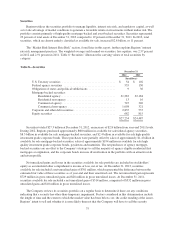
Professional and Legal Expenses
Professional and legal expenses are comprised of amounts related to legal, consulting and other professional
fees. These expenses decreased $61 million or 35 percent to $114 million in 2012, reflecting a decrease in the
level of legal expenses and recognition of recoveries from previously established legal accruals. Refer to Note 23
“Commitments, Contingencies and Guarantees” to the consolidated financial statements for additional
information.
Amortization of Core Deposit Intangibles
The premium paid for core deposits in an acquisition is considered to be an intangible asset that is amortized
on an accelerated basis over its useful life. As a result, amortization of core deposit intangibles decreased
13 percent to $83 million in 2012 compared to $95 million in 2011. Regions reviews core deposit intangibles for
events or circumstances which could impact the recoverability of the intangible assets. Regions’ annual 2012
impairment test resulted in no impairment. The test reflected an increase in the estimated life of Regions’ core
deposit intangibles. Amortization expense will be revised to reflect the increased estimated life beginning in
2013. See Note 9 “Intangible Assets” to the consolidated financial statements for additional information.
Other Real Estate Owned Expense
Other real estate owned (“OREO”) expense includes the cost of adjusting foreclosed properties and other
property held for sale to estimated fair value after these assets have been classified as OREO, net gains and losses
on sales of properties, and other costs to maintain the property such as property taxes, security, and grounds
maintenance. Through Regions’ efforts to sell foreclosed properties, those balances decreased $147 million to
$149 million in 2012. This reduction in foreclosed properties balances, along with lower valuation charges as a
result of stabilizing real estate values, was the primary driver of the $110 million decline in OREO expense in
2012. See the “Foreclosed Properties” section later in the “Balance Sheet Analysis” section.
Credit/Checkcard Expenses
Credit/checkcard expenses increased $14 million for 2012 when compared to 2011. The year-over-year
increase is due to the effect of an entire year’s worth of impact from the credit card portfolio purchase at the end
of the second quarter of 2011.
Branch Consolidation and Property and Equipment Charges
Non-interest expense in 2011 included $75 million of branch consolidation charges related to lower of cost
or market adjustments on owned branch property, terminated ground leases and impairment of other equipment.
The charges were driven primarily by Regions’ decision to consolidate approximately 40 branches.
(Gain)/Loss on Loans Held for Sale, Net
The Company recorded a $61 million reduction in non-interest expense for 2012 related to gains on loans
held for sale. The Company recorded losses on loans held for sale of $1 million for 2011. The improvement
during 2012 relates to sales and paydowns of individual loans at amounts in excess of carrying value.
Deposit Administrative Fees
Deposit administrative fees decreased in 2012 by $55 million to $162 million. Deposit administrative fees
were impacted by a new assessment rule in 2011, which revised the deposit insurance assessment system for
large institutions. The new rule changed the assessment base from deposits as the basis and utilizes a risk-based
approach which calculates the assessment using average consolidated assets minus average tangible equity.
Implementation of the new rule was effective beginning in the second quarter of 2011. The bank regulatory
71