Regions Bank 2012 Annual Report Download - page 162
Download and view the complete annual report
Please find page 162 of the 2012 Regions Bank annual report below. You can navigate through the pages in the report by either clicking on the pages listed below, or by using the keyword search tool below to find specific information within the annual report.-
 1
1 -
2
-
3
-
4
-
5
-
6
-
7
-
8
-
9
-
10
-
11
-
12
-
13
-
14
-
15
-
16
-
17
-
18
-
19
-
20
-
21
-
22
-
23
-
24
-
25
-
26
-
27
-
28
-
29
-
30
-
31
-
32
-
33
-
34
-
35
-
36
-
37
-
38
-
39
-
40
-
41
-
42
-
43
-
44
-
45
-
46
-
47
-
48
-
49
-
50
-
51
-
52
-
53
-
54
-
55
-
56
-
57
-
58
-
59
-
60
-
61
-
62
-
63
-
64
-
65
-
66
-
67
-
68
-
69
-
70
-
71
-
72
-
73
-
74
-
75
-
76
-
77
-
78
-
79
-
80
-
81
-
82
-
83
-
84
-
85
-
86
-
87
-
88
-
89
-
90
-
91
-
92
-
93
-
94
-
95
-
96
-
97
-
98
-
99
-
100
-
101
-
102
-
103
-
104
-
105
-
106
-
107
-
108
-
109
-
110
-
111
-
112
-
113
-
114
-
115
-
116
-
117
-
118
-
119
-
120
-
121
-
122
-
123
-
124
-
125
-
126
-
127
-
128
-
129
-
130
-
131
-
132
-
133
-
134
-
135
-
136
-
137
-
138
-
139
-
140
-
141
-
142
-
143
-
144
-
145
-
146
-
147
-
148
-
149
-
150
-
151
-
 152
152 -
 153
153 -
 154
154 -
 155
155 -
 156
156 -
 157
157 -
 158
158 -
 159
159 -
 160
160 -
 161
161 -
 162
162 -
 163
163 -
 164
164 -
 165
165 -
 166
166 -
 167
167 -
 168
168 -
 169
169 -
 170
170 -
 171
171 -
 172
172 -
173
-
174
-
175
-
176
-
177
-
178
-
179
-
180
-
181
-
182
-
183
-
184
-
185
-
186
-
187
-
188
-
189
-
190
-
191
-
192
-
193
-
194
-
195
-
196
-
197
-
198
-
199
-
200
-
201
-
202
-
203
-
204
-
205
-
206
-
207
-
208
-
209
-
210
-
211
-
212
-
213
-
214
-
215
-
216
-
217
-
218
-
219
-
220
-
221
-
222
-
223
-
224
-
225
-
226
-
227
-
228
-
229
-
230
-
231
-
232
-
233
-
234
-
235
-
236
-
237
-
238
-
239
-
240
-
241
-
242
-
243
-
244
-
245
-
246
-
247
-
248
-
249
-
250
-
251
-
252
-
253
-
254
 |
 |

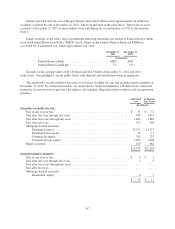
NOTE 4. SECURITIES
The amortized cost, gross unrealized gains and losses, and estimated fair value of securities available for
sale and securities held to maturity are as follows:
December 31, 2012
Amortized
Cost
Gross
Unrealized
Gains
Gross
Unrealized
Losses
Estimated
Fair
Value
(In millions)
Securities available for sale:
U.S. Treasury securities .............................. $ 50 $ 2 $— $ 52
Federal agency securities ............................. 550 4 (1) 553
Obligations of states and political subdivisions ............ 9 — — 9
Mortgage-backed securities:
Residential agency .............................. 20,721 574 (18) 21,277
Residential non-agency ........................... 12 1 — 13
Commercial agency .............................. 705 20 — 725
Commercial non-agency .......................... 1,055 43 — 1,098
Corporate and other debt securities ...................... 2,762 81 (8) 2,835
Equity securities .................................... 679 4 (1) 682
$26,543 $729 $ (28) $27,244
Securities held to maturity:
U.S. Treasury securities .............................. $ 2 $— $— $ 2
Federal agency securities ............................. 2 — — 2
Mortgage-backed securities:
Residential agency .............................. 6 1 — 7
$10 $1 $— $11
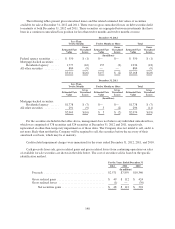
December 31, 2011
Amortized
Cost
Gross
Unrealized
Gains
Gross
Unrealized
Losses
Estimated
Fair
Value
(In millions)
Securities available for sale:
U.S. Treasury securities .............................. $ 95 $ 3 $— $ 98
Federal agency securities ............................. 147 — — 147
Obligations of states and political subdivisions ............ 24 12 — 36
Mortgage-backed securities:
Residential agency .............................. 21,688 494 (7) 22,175
Residential non-agency ........................... 15 1 — 16
Commercial agency .............................. 318 8 — 326
Commercial non-agency .......................... 314 7 — 321
Corporate and other debt securities ...................... 539 5 (7) 537
Equity securities .................................... 817 2 (4) 815
$23,957 $532 $ (18) $24,471
Securities held to maturity:
U.S. Treasury securities .............................. $ 4 $— $— $ 4
Federal agency securities ............................. 3 — — 3
Mortgage-backed securities:
Residential agency .............................. 9 1 — 10
$16 $1 $— $17
146