Regions Bank 2012 Annual Report Download - page 180
Download and view the complete annual report
Please find page 180 of the 2012 Regions Bank annual report below. You can navigate through the pages in the report by either clicking on the pages listed below, or by using the keyword search tool below to find specific information within the annual report.-
 1
1 -
2
-
3
-
4
-
5
-
6
-
7
-
8
-
9
-
10
-
11
-
12
-
13
-
14
-
15
-
16
-
17
-
18
-
19
-
20
-
21
-
22
-
23
-
24
-
25
-
26
-
27
-
28
-
29
-
30
-
31
-
32
-
33
-
34
-
35
-
36
-
37
-
38
-
39
-
40
-
41
-
42
-
43
-
44
-
45
-
46
-
47
-
48
-
49
-
50
-
51
-
52
-
53
-
54
-
55
-
56
-
57
-
58
-
59
-
60
-
61
-
62
-
63
-
64
-
65
-
66
-
67
-
68
-
69
-
70
-
71
-
72
-
73
-
74
-
75
-
76
-
77
-
78
-
79
-
80
-
81
-
82
-
83
-
84
-
85
-
86
-
87
-
88
-
89
-
90
-
91
-
92
-
93
-
94
-
95
-
96
-
97
-
98
-
99
-
100
-
101
-
102
-
103
-
104
-
105
-
106
-
107
-
108
-
109
-
110
-
111
-
112
-
113
-
114
-
115
-
116
-
117
-
118
-
119
-
120
-
121
-
122
-
123
-
124
-
125
-
126
-
127
-
128
-
129
-
130
-
131
-
132
-
133
-
134
-
135
-
136
-
137
-
138
-
139
-
140
-
141
-
142
-
143
-
144
-
145
-
146
-
147
-
148
-
149
-
150
-
151
-
152
-
153
-
154
-
155
-
156
-
157
-
158
-
159
-
160
-
161
-
162
-
163
-
164
-
165
-
166
-
167
-
168
-
169
-
 170
170 -
 171
171 -
 172
172 -
 173
173 -
 174
174 -
 175
175 -
 176
176 -
 177
177 -
 178
178 -
 179
179 -
 180
180 -
 181
181 -
 182
182 -
 183
183 -
 184
184 -
 185
185 -
 186
186 -
 187
187 -
 188
188 -
 189
189 -
 190
190 -
191
-
192
-
193
-
194
-
195
-
196
-
197
-
198
-
199
-
200
-
201
-
202
-
203
-
204
-
205
-
206
-
207
-
208
-
209
-
210
-
211
-
212
-
213
-
214
-
215
-
216
-
217
-
218
-
219
-
220
-
221
-
222
-
223
-
224
-
225
-
226
-
227
-
228
-
229
-
230
-
231
-
232
-
233
-
234
-
235
-
236
-
237
-
238
-
239
-
240
-
241
-
242
-
243
-
244
-
245
-
246
-
247
-
248
-
249
-
250
-
251
-
252
-
253
-
254
 |
 |

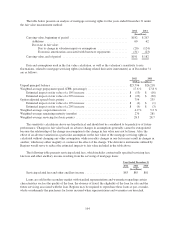
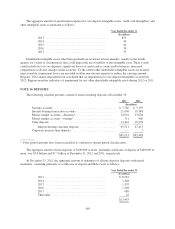
The table below presents an analysis of mortgage servicing rights for the years ended December 31 under
the fair value measurement method:
2012 2011
(In millions)
Carrying value, beginning of period ....................................... $182 $ 267
Additions ........................................................ 60 62
Decrease in fair value:
Due to change in valuation inputs or assumptions .................... (20) (124)
Economic amortization associated with borrower repayments ........... (31) (23)
Carrying value, end of period ............................................ $191 $ 182
Data and assumptions used in the fair value calculation, as well as the valuation’s sensitivity to rate
fluctuations, related to mortgage servicing rights (excluding related derivative instruments) as of December 31
are as follows:
2012 2011
(Dollars in millions)
Unpaid principal balance .................................................... $25,796 $26,218
Weighted-average prepayment speed (CPR; percentage) ........................... 17.6 % 27.8 %
Estimated impact on fair value of a 10% increase ............................ $ (13) $ (16)
Estimated impact on fair value of a 20% increase ............................ $ (23) $ (30)
Option-adjusted spread (basis points) .......................................... 754 235
Estimated impact on fair value of a 10% increase ............................ $ (4) $ (1)
Estimated impact on fair value of a 20% increase ............................ $ (9) $ (3)
Weighted-average coupon interest rate ......................................... 4.9% 5.2%
Weighted-average remaining maturity (months) ................................. 276 281
Weighted-average servicing fee (basis points) ................................... 28.3 28.7
The sensitivity calculations above are hypothetical and should not be considered to be predictive of future
performance. Changes in fair value based on adverse changes in assumptions generally cannot be extrapolated
because the relationship of the change in assumption to the change in fair value may not be linear. Also, the
effect of an adverse variation in a particular assumption on the fair value of the mortgage servicing rights is
calculated without changing any other assumption, while in reality changes in one factor may result in changes in
another, which may either magnify or counteract the effect of the change. The derivative instruments utilized by
Regions would serve to reduce the estimated impacts to fair value included in the table above.
The following table presents servicing related fees, which includes contractually specified servicing fees,
late fees and other ancillary income resulting from the servicing of mortgage loans:
Year Ended December 31
2012 2011 2010
(In millions)
Servicing related fees and other ancillary income ....................... $83 $85 $81
Loans are sold in the secondary market with standard representations and warranties regarding certain
characteristics such as the quality of the loan, the absence of fraud, the eligibility of the loan for sale and the
future servicing associated with the loan. Regions may be required to repurchase these loans at par, or make-
whole or indemnify the purchasers for losses incurred when representations and warranties are breached.
164