Regions Bank 2012 Annual Report Download - page 85
Download and view the complete annual report
Please find page 85 of the 2012 Regions Bank annual report below. You can navigate through the pages in the report by either clicking on the pages listed below, or by using the keyword search tool below to find specific information within the annual report.-
 1
1 -
2
-
3
-
4
-
5
-
6
-
7
-
8
-
9
-
10
-
11
-
12
-
13
-
14
-
15
-
16
-
17
-
18
-
19
-
20
-
21
-
22
-
23
-
24
-
25
-
26
-
27
-
28
-
29
-
30
-
31
-
32
-
33
-
34
-
35
-
36
-
37
-
38
-
39
-
40
-
41
-
42
-
43
-
44
-
45
-
46
-
47
-
48
-
49
-
50
-
51
-
52
-
53
-
54
-
55
-
56
-
57
-
58
-
59
-
60
-
61
-
62
-
63
-
64
-
65
-
66
-
67
-
68
-
69
-
70
-
71
-
72
-
73
-
74
-
 75
75 -
 76
76 -
 77
77 -
 78
78 -
 79
79 -
 80
80 -
 81
81 -
 82
82 -
 83
83 -
 84
84 -
 85
85 -
 86
86 -
 87
87 -
 88
88 -
 89
89 -
 90
90 -
 91
91 -
 92
92 -
 93
93 -
 94
94 -
 95
95 -
96
-
97
-
98
-
99
-
100
-
101
-
102
-
103
-
104
-
105
-
106
-
107
-
108
-
109
-
110
-
111
-
112
-
113
-
114
-
115
-
116
-
117
-
118
-
119
-
120
-
121
-
122
-
123
-
124
-
125
-
126
-
127
-
128
-
129
-
130
-
131
-
132
-
133
-
134
-
135
-
136
-
137
-
138
-
139
-
140
-
141
-
142
-
143
-
144
-
145
-
146
-
147
-
148
-
149
-
150
-
151
-
152
-
153
-
154
-
155
-
156
-
157
-
158
-
159
-
160
-
161
-
162
-
163
-
164
-
165
-
166
-
167
-
168
-
169
-
170
-
171
-
172
-
173
-
174
-
175
-
176
-
177
-
178
-
179
-
180
-
181
-
182
-
183
-
184
-
185
-
186
-
187
-
188
-
189
-
190
-
191
-
192
-
193
-
194
-
195
-
196
-
197
-
198
-
199
-
200
-
201
-
202
-
203
-
204
-
205
-
206
-
207
-
208
-
209
-
210
-
211
-
212
-
213
-
214
-
215
-
216
-
217
-
218
-
219
-
220
-
221
-
222
-
223
-
224
-
225
-
226
-
227
-
228
-
229
-
230
-
231
-
232
-
233
-
234
-
235
-
236
-
237
-
238
-
239
-
240
-
241
-
242
-
243
-
244
-
245
-
246
-
247
-
248
-
249
-
250
-
251
-
252
-
253
-
254
 |
 |
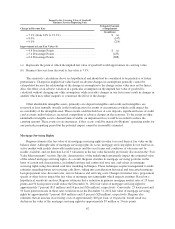
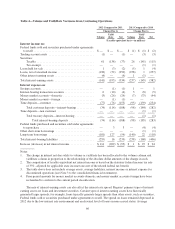
Securities Gains, Net
Regions reported net gains of $48 million from the sale of securities available for sale in 2012, as compared
to net gains of $112 million in 2011. Lower security gains during 2012 were due to lower volumes of securities
sales resulting from the Company’s asset/liability management process. Refer to the “Securities” section in the
“Balance Sheet Analysis” for further discussion.
Insurance Commissions and Fees
Regions provides property and casualty, life and health, mortgage, title and other specialty insurance and
credit related products to businesses and individuals. Insurance commissions and fees increased 3 percent to $109
million in 2012, compared to $106 million in 2011. The increase is primarily due to growth in the agency
business as well as stabilizing insurance rates and exposures.
Leveraged Lease Termination Gains
Regions terminated certain leveraged leases in 2012 and 2011 resulting in gains of $14 million and
$8 million, respectively. These termination gains were largely offset by increases in income tax expense.
Commercial Credit Fee Income
Commercial credit fee income decreased 15 percent to $68 million in 2012, compared to $80 million in
2011. This decrease is primarily due to a decline in standby letters of credit. Regions’ ability to originate standby
letters of credit has been impacted by its credit rating in the prior years, as many beneficiaries require investment
grade ratings for the issuing bank. During 2012, Moody’s and S&P upgraded credit ratings for Regions Financial
Corporation and its subsidiaries.
Bank-Owned Life Insurance
Bank-owned life insurance income decreased 2 percent to $81 million in 2012, compared to $83 million in
2011. This decrease is primarily due to a decline in death benefits and crediting rates.
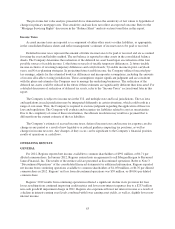
Credit Card / Bank Card Income
Credit card / bank card income increased $20 million in 2012 as compared to 2011. Credit card income is
derived from activity related to the Regions-branded credit card portfolio purchased from FIA Card Services in
the second quarter of 2011 and subsequent originations. Bank card income relates to commercial purchasing
cards. The increase during 2012 is due to an entire year’s worth of impact from the 2011 credit card portfolio
purchase.
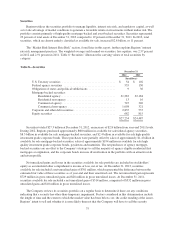
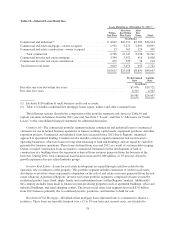
NON-INTEREST EXPENSE
The following section contains a discussion of non-interest expense from continuing operations. The largest
components of non-interest expense are salaries and employee benefits, net occupancy expense and furniture and
equipment expense. Non-interest expense in 2012 was down $336 million from 2011. Non-interest expense in
2011 included $253 million in goodwill impairment plus $75 million in branch consolidation and property and
equipment charges. The decline in non-interest expense in 2012 included $61 million in net gains related to the
sale of loans held for sale in excess of their carrying values, plus a reduction in other real estate owned expenses
of $110 million partially offset by a $159 million increase in salaries and employee benefits. Table 6 “Non-
Interest Expense from Continuing Operations” presents total non-interest expense for the years ended
December 31, 2012, 2011 and 2010.
69