Regions Bank 2012 Annual Report Download - page 7
Download and view the complete annual report
Please find page 7 of the 2012 Regions Bank annual report below. You can navigate through the pages in the report by either clicking on the pages listed below, or by using the keyword search tool below to find specific information within the annual report.-
 1
1 -
 2
2 -
 3
3 -
 4
4 -
 5
5 -
 6
6 -
 7
7 -
 8
8 -
 9
9 -
 10
10 -
 11
11 -
 12
12 -
 13
13 -
 14
14 -
 15
15 -
 16
16 -
 17
17 -
 18
18 -
19
-
20
-
21
-
22
-
23
-
24
-
25
-
26
-
27
-
28
-
29
-
30
-
31
-
32
-
33
-
34
-
35
-
36
-
37
-
38
-
39
-
40
-
41
-
42
-
43
-
44
-
45
-
46
-
47
-
48
-
49
-
50
-
51
-
52
-
53
-
54
-
55
-
56
-
57
-
58
-
59
-
60
-
61
-
62
-
63
-
64
-
65
-
66
-
67
-
68
-
69
-
70
-
71
-
72
-
73
-
74
-
75
-
76
-
77
-
78
-
79
-
80
-
81
-
82
-
83
-
84
-
85
-
86
-
87
-
88
-
89
-
90
-
91
-
92
-
93
-
94
-
95
-
96
-
97
-
98
-
99
-
100
-
101
-
102
-
103
-
104
-
105
-
106
-
107
-
108
-
109
-
110
-
111
-
112
-
113
-
114
-
115
-
116
-
117
-
118
-
119
-
120
-
121
-
122
-
123
-
124
-
125
-
126
-
127
-
128
-
129
-
130
-
131
-
132
-
133
-
134
-
135
-
136
-
137
-
138
-
139
-
140
-
141
-
142
-
143
-
144
-
145
-
146
-
147
-
148
-
149
-
150
-
151
-
152
-
153
-
154
-
155
-
156
-
157
-
158
-
159
-
160
-
161
-
162
-
163
-
164
-
165
-
166
-
167
-
168
-
169
-
170
-
171
-
172
-
173
-
174
-
175
-
176
-
177
-
178
-
179
-
180
-
181
-
182
-
183
-
184
-
185
-
186
-
187
-
188
-
189
-
190
-
191
-
192
-
193
-
194
-
195
-
196
-
197
-
198
-
199
-
200
-
201
-
202
-
203
-
204
-
205
-
206
-
207
-
208
-
209
-
210
-
211
-
212
-
213
-
214
-
215
-
216
-
217
-
218
-
219
-
220
-
221
-
222
-
223
-
224
-
225
-
226
-
227
-
228
-
229
-
230
-
231
-
232
-
233
-
234
-
235
-
236
-
237
-
238
-
239
-
240
-
241
-
242
-
243
-
244
-
245
-
246
-
247
-
248
-
249
-
250
-
251
-
252
-
253
-
254
 |
 |
REGIONS 2012 ANNUAL REPORT
5
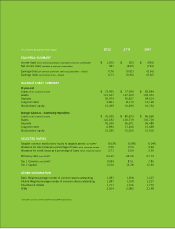
to specialized lending where our local bankers work
with experienced lenders to meet customer needs.
Total new production for this portfolio was a solid $15
billion, up 3% from 2011. We finished the year with
new business pipelines slightly above the same level
at the end of 2011, and loan commitments increased
12% from the prior year.
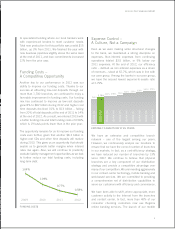
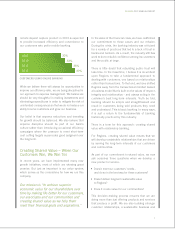
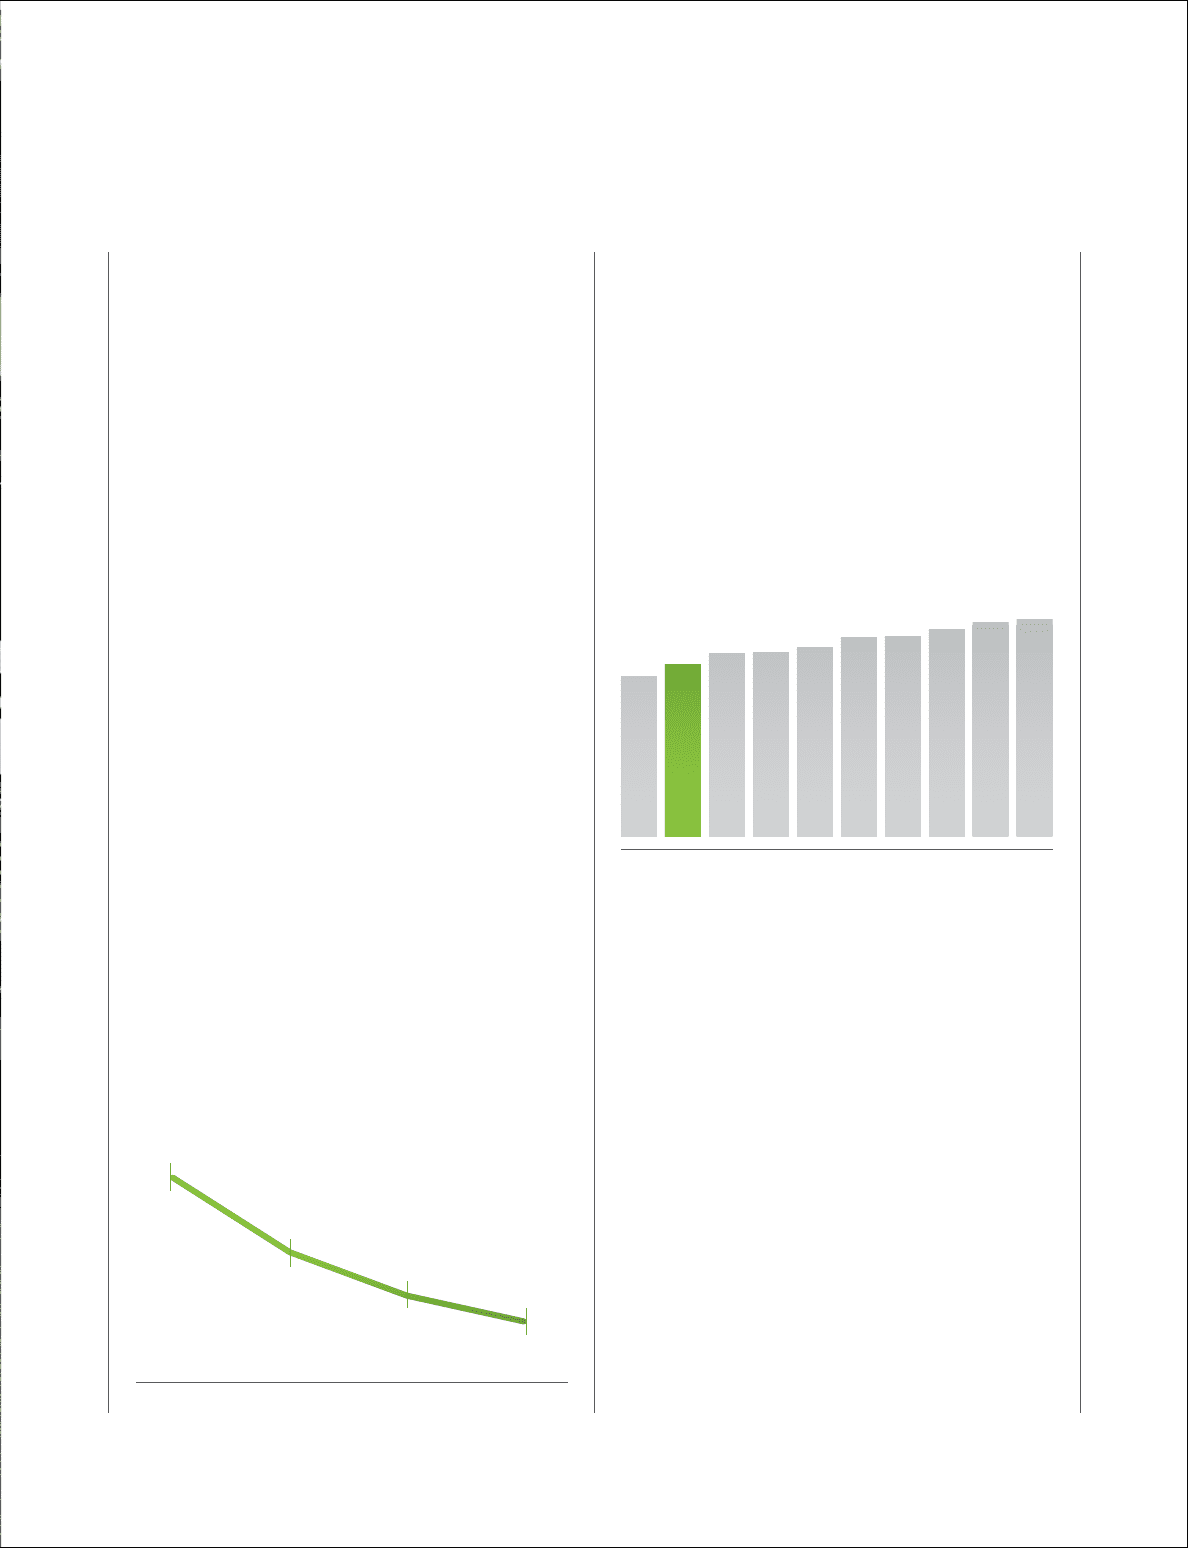
Funding Costs –
A Competitive Opportunity
Another key to our performance in 2012 was our
ability to improve our funding costs. Thanks to our
success at attracting low-cost deposits through our
more than 1,700 branches, we continued to enjoy a
favorable improvement in funding costs. Our funding
mix has continued to improve as low-cost deposits
grew 8% to $82 billion during 2012 and higher cost
time deposits declined 31% to $13 billion – falling
from 20% of total deposits at the end of 2011 to 14%
at the end of 2012. As a result, we entered 2013 with
a better funding mix and total funding costs of 0.58%,
which is 19 basis points lower than in the prior year.
The opportunity remains for us to improve our funding
costs even further, given that another $8.3 billion in
higher-cost CDs and other time deposits will mature
during 2013. This gives us an opportunity that should
enable us to generate better margins when interest
rates rise again. Also, we will continue to prudently
evaluate liability management opportunities as we look
to further reduce our total funding costs, including
long-term debt.
Expense Control –
A Culture, Not a Campaign
Even as we were making some structural changes
to the bank, we maintained a strong discipline on
expenses. Non-interest expenses from continuing
operations totaled $3.5 billion, or 9% below our
2011 expenses. At the end of 2012, our efficiency
ratio – defined as non-interest expenses as a share
of revenues – stood at 62.7%, which was in line with
our peer group. Among the banks in our peer group,
we have the second lowest expense-to-assets ratio
at 2.79%.
We have an extensive and competitive branch
network – one of the largest among our peers.
However, we continuously analyze our locations to
ensure that we have the correct number of branches
in our markets. In fact, as a cost-efficiency strategy,
we have reduced our number of branches by 13%
since 2007. We continue to believe that physical
branches are a key component of our distribution
strategy and provide a competitive advantage over
many of our competitors. We are investing aggressively
in our contact center technology, mobile banking and
web-based services. We are committed to providing
a comprehensive set of distribution capabilities to
serve our customers with efficiency and convenience.
We have been able to shift, where appropriate, more
customer activity to the Internet from the branches
and contact center. In fact, more than 40% of our
consumer checking customers now use Regions
online banking services. The launch of our mobile
2009 2010 2011 2012
1.09%
1.64%
0.77%
0.58%
EXPENSE-TO-ASSETS RATIO VS. PEERS
REGIONS
BANK #1
BANK #3
BANK #5
BANK #4
BANK #6
BANK #7
BANK #8
BANK #9
BANK #10
2.79% 2.97%
2.60%
2.98% 3.06% 3.22% 3.25% 3.36% 3.47% 3.51%
FUNDING COSTS