Regions Bank 2012 Annual Report Download - page 199
Download and view the complete annual report
Please find page 199 of the 2012 Regions Bank annual report below. You can navigate through the pages in the report by either clicking on the pages listed below, or by using the keyword search tool below to find specific information within the annual report.-
 1
1 -
2
-
3
-
4
-
5
-
6
-
7
-
8
-
9
-
10
-
11
-
12
-
13
-
14
-
15
-
16
-
17
-
18
-
19
-
20
-
21
-
22
-
23
-
24
-
25
-
26
-
27
-
28
-
29
-
30
-
31
-
32
-
33
-
34
-
35
-
36
-
37
-
38
-
39
-
40
-
41
-
42
-
43
-
44
-
45
-
46
-
47
-
48
-
49
-
50
-
51
-
52
-
53
-
54
-
55
-
56
-
57
-
58
-
59
-
60
-
61
-
62
-
63
-
64
-
65
-
66
-
67
-
68
-
69
-
70
-
71
-
72
-
73
-
74
-
75
-
76
-
77
-
78
-
79
-
80
-
81
-
82
-
83
-
84
-
85
-
86
-
87
-
88
-
89
-
90
-
91
-
92
-
93
-
94
-
95
-
96
-
97
-
98
-
99
-
100
-
101
-
102
-
103
-
104
-
105
-
106
-
107
-
108
-
109
-
110
-
111
-
112
-
113
-
114
-
115
-
116
-
117
-
118
-
119
-
120
-
121
-
122
-
123
-
124
-
125
-
126
-
127
-
128
-
129
-
130
-
131
-
132
-
133
-
134
-
135
-
136
-
137
-
138
-
139
-
140
-
141
-
142
-
143
-
144
-
145
-
146
-
147
-
148
-
149
-
150
-
151
-
152
-
153
-
154
-
155
-
156
-
157
-
158
-
159
-
160
-
161
-
162
-
163
-
164
-
165
-
166
-
167
-
168
-
169
-
170
-
171
-
172
-
173
-
174
-
175
-
176
-
177
-
178
-
179
-
180
-
181
-
182
-
183
-
184
-
185
-
186
-
187
-
188
-
 189
189 -
 190
190 -
 191
191 -
 192
192 -
 193
193 -
 194
194 -
 195
195 -
 196
196 -
 197
197 -
 198
198 -
 199
199 -
 200
200 -
 201
201 -
 202
202 -
 203
203 -
 204
204 -
 205
205 -
 206
206 -
 207
207 -
 208
208 -
 209
209 -
210
-
211
-
212
-
213
-
214
-
215
-
216
-
217
-
218
-
219
-
220
-
221
-
222
-
223
-
224
-
225
-
226
-
227
-
228
-
229
-
230
-
231
-
232
-
233
-
234
-
235
-
236
-
237
-
238
-
239
-
240
-
241
-
242
-
243
-
244
-
245
-
246
-
247
-
248
-
249
-
250
-
251
-
252
-
253
-
254
 |
 |

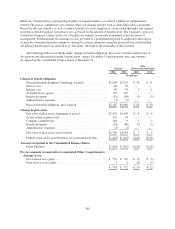
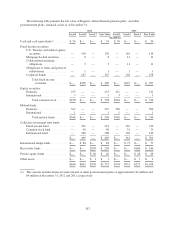
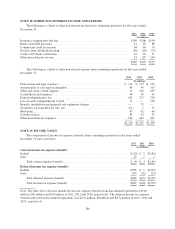
The following table presents the fair value of Regions’ defined-benefit pension plans’ and other
postretirement plans’ financial assets as of December 31:
2012 2011
Level 1 Level 2 Level 3 Fair Value Level 1 Level 2 Level 3 Fair Value
(In millions)
Cash and cash equivalents(1) ........ $ 34 $— $— $ 34 $ 30 $— $— $ 30
Fixed income securities:
U.S. Treasury and federal agency
securities ................. — 130 — 130 — 116 — 116
Mortgage-backed securities .... — 8 — 8 — 11 — 11
Collateralized mortgage
obligations ................ — 3 — 3 — 11 — 11
Obligations of states and political
subdivisions .............. — 1 — 1 — 1 — 1
Corporate bonds ............. — 167 — 167 — 158 — 158
Total fixed income
securities ............. $— $309 $— $ 309 $— $297 $— $ 297
Equity securities:
Domestic ................... 253 — — 253 211 — — 211
International ................ 5 — — 5 3 — — 3
Total common stock ...... $258 $— $— $ 258 $214 $— $— $ 214
Mutual funds:
Domestic ................... 347 — — 347 309 — — 309
International ................ 1 — — 1 1 — — 1
Total mutual funds ....... $348 $— $— $ 348 $310 $— $— $ 310
Collective investment trust funds:
Fixed income fund ........... — 221 — 221 — 210 — 210
Common stock fund .......... — 40 — 40 — 31 — 31
International fund ............ — 208 — 208 — 120 — 120
$— 469 — $ 469 $— 361 — $ 361
International hedge funds .......... $— $ 84 $— $ 84 $— $ 73 $— $ 73
Real estate funds ................. $— $— $203 $ 203 $— $— $186 $ 186
Private equity funds .............. $— $— $ 46 $ 46 $— $— $ 26 $ 26
Other assets ..................... $— $— $ 1 $ 1 $— $— $ 1 $ 1
$640 $862 $250 $1,752 $554 $731 $213 $1,498
(1) This amount includes financial assets related to other postretirement plans of approximately $3 million and
$4 million at December 31, 2012 and 2011, respectively.
183