Regions Bank 2012 Annual Report Download - page 172
Download and view the complete annual report
Please find page 172 of the 2012 Regions Bank annual report below. You can navigate through the pages in the report by either clicking on the pages listed below, or by using the keyword search tool below to find specific information within the annual report.-
 1
1 -
2
-
3
-
4
-
5
-
6
-
7
-
8
-
9
-
10
-
11
-
12
-
13
-
14
-
15
-
16
-
17
-
18
-
19
-
20
-
21
-
22
-
23
-
24
-
25
-
26
-
27
-
28
-
29
-
30
-
31
-
32
-
33
-
34
-
35
-
36
-
37
-
38
-
39
-
40
-
41
-
42
-
43
-
44
-
45
-
46
-
47
-
48
-
49
-
50
-
51
-
52
-
53
-
54
-
55
-
56
-
57
-
58
-
59
-
60
-
61
-
62
-
63
-
64
-
65
-
66
-
67
-
68
-
69
-
70
-
71
-
72
-
73
-
74
-
75
-
76
-
77
-
78
-
79
-
80
-
81
-
82
-
83
-
84
-
85
-
86
-
87
-
88
-
89
-
90
-
91
-
92
-
93
-
94
-
95
-
96
-
97
-
98
-
99
-
100
-
101
-
102
-
103
-
104
-
105
-
106
-
107
-
108
-
109
-
110
-
111
-
112
-
113
-
114
-
115
-
116
-
117
-
118
-
119
-
120
-
121
-
122
-
123
-
124
-
125
-
126
-
127
-
128
-
129
-
130
-
131
-
132
-
133
-
134
-
135
-
136
-
137
-
138
-
139
-
140
-
141
-
142
-
143
-
144
-
145
-
146
-
147
-
148
-
149
-
150
-
151
-
152
-
153
-
154
-
155
-
156
-
157
-
158
-
159
-
160
-
161
-
 162
162 -
 163
163 -
 164
164 -
 165
165 -
 166
166 -
 167
167 -
 168
168 -
 169
169 -
 170
170 -
 171
171 -
 172
172 -
 173
173 -
 174
174 -
 175
175 -
 176
176 -
 177
177 -
 178
178 -
 179
179 -
 180
180 -
 181
181 -
 182
182 -
183
-
184
-
185
-
186
-
187
-
188
-
189
-
190
-
191
-
192
-
193
-
194
-
195
-
196
-
197
-
198
-
199
-
200
-
201
-
202
-
203
-
204
-
205
-
206
-
207
-
208
-
209
-
210
-
211
-
212
-
213
-
214
-
215
-
216
-
217
-
218
-
219
-
220
-
221
-
222
-
223
-
224
-
225
-
226
-
227
-
228
-
229
-
230
-
231
-
232
-
233
-
234
-
235
-
236
-
237
-
238
-
239
-
240
-
241
-
242
-
243
-
244
-
245
-
246
-
247
-
248
-
249
-
250
-
251
-
252
-
253
-
254
 |
 |

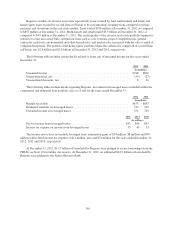
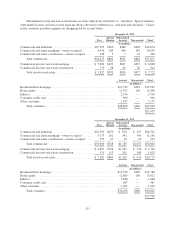
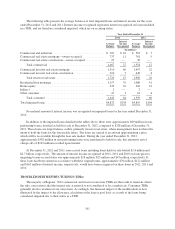
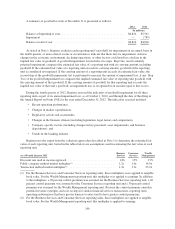
AGING ANALYSIS
The following tables include an aging analysis of days past due (DPD) for each portfolio segment and class:
December 31, 2012
Accrual Loans
30-59 DPD 60-89 DPD 90+ DPD Total 30+ DPD Total Accrual Non-accrual Total
(In millions)
Commercial and industrial ........ $ 27 $ 23 $ 19 $ 69 $26,265 $ 409 $26,674
Commercial real estate mortgage—
owner-occupied .............. 49 28 6 83 9,656 439 10,095
Commercial real estate
construction—owner-occupied . . . — — — — 288 14 302
Total commercial ........... 76 51 25 152 36,209 862 37,071
Commercial investor real estate
mortgage .................... 38 42 11 91 6,351 457 6,808
Commercial investor real estate
construction ................. 1 1 — 2 894 20 914
Total investor real estate ...... 39 43 11 93 7,245 477 7,722
Residential first mortgage ......... 149 86 307 542 12,749 214 12,963
Home equity ................... 100 53 87 240 11,672 128 11,800
Indirect ....................... 31 9 3 43 2,336 — 2,336
Consumer credit card ............ 7 7 14 28 906 — 906
Other consumer ................. 19 5 3 27 1,197 — 1,197
Total consumer ............. 306 160 414 880 28,860 342 29,202
$421 $254 $450 $1,125 $72,314 $1,681 $73,995
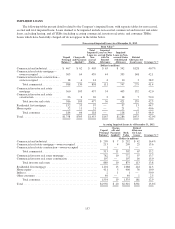
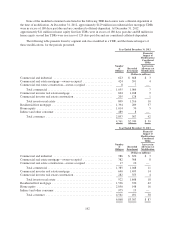
December 31, 2011
Accrual Loans
30-59 DPD 60-89 DPD 90+ DPD Total 30+ DPD Total Accrual Non-accrual Total
(In millions)
Commercial and industrial ........ $ 38 $ 23 $ 28 $ 89 $24,065 $ 457 $24,522
Commercial real estate mortgage—
owner-occupied .............. 47 23 9 79 10,576 590 11,166
Commercial real estate
construction—owner-occupied . . . 3 1 — 4 312 25 337
Total commercial ........... 88 47 37 172 34,953 1,072 36,025
Commercial investor real estate
mortgage .................... 34 42 13 89 8,968 734 9,702
Commercial investor real estate
construction ................. 23 5 — 28 845 180 1,025
Total investor real estate ...... 57 47 13 117 9,813 914 10,727
Residential first mortgage ......... 187 100 284 571 13,534 250 13,784
Home equity ................... 121 77 93 291 12,885 136 13,021
Indirect ....................... 26 7 2 35 1,848 — 1,848
Consumer credit card ............ 8 5 14 27 987 — 987
Other consumer ................. 20 6 4 30 1,202 — 1,202
Total consumer ............. 362 195 397 954 30,456 386 30,842
$507 $289 $447 $1,243 $75,222 $2,372 $77,594
156