Regions Bank 2012 Annual Report Download - page 67
Download and view the complete annual report
Please find page 67 of the 2012 Regions Bank annual report below. You can navigate through the pages in the report by either clicking on the pages listed below, or by using the keyword search tool below to find specific information within the annual report.-
 1
1 -
2
-
3
-
4
-
5
-
6
-
7
-
8
-
9
-
10
-
11
-
12
-
13
-
14
-
15
-
16
-
17
-
18
-
19
-
20
-
21
-
22
-
23
-
24
-
25
-
26
-
27
-
28
-
29
-
30
-
31
-
32
-
33
-
34
-
35
-
36
-
37
-
38
-
39
-
40
-
41
-
42
-
43
-
44
-
45
-
46
-
47
-
48
-
49
-
50
-
51
-
52
-
53
-
54
-
55
-
56
-
 57
57 -
 58
58 -
 59
59 -
 60
60 -
 61
61 -
 62
62 -
 63
63 -
 64
64 -
 65
65 -
 66
66 -
 67
67 -
 68
68 -
 69
69 -
 70
70 -
 71
71 -
 72
72 -
 73
73 -
 74
74 -
 75
75 -
 76
76 -
 77
77 -
78
-
79
-
80
-
81
-
82
-
83
-
84
-
85
-
86
-
87
-
88
-
89
-
90
-
91
-
92
-
93
-
94
-
95
-
96
-
97
-
98
-
99
-
100
-
101
-
102
-
103
-
104
-
105
-
106
-
107
-
108
-
109
-
110
-
111
-
112
-
113
-
114
-
115
-
116
-
117
-
118
-
119
-
120
-
121
-
122
-
123
-
124
-
125
-
126
-
127
-
128
-
129
-
130
-
131
-
132
-
133
-
134
-
135
-
136
-
137
-
138
-
139
-
140
-
141
-
142
-
143
-
144
-
145
-
146
-
147
-
148
-
149
-
150
-
151
-
152
-
153
-
154
-
155
-
156
-
157
-
158
-
159
-
160
-
161
-
162
-
163
-
164
-
165
-
166
-
167
-
168
-
169
-
170
-
171
-
172
-
173
-
174
-
175
-
176
-
177
-
178
-
179
-
180
-
181
-
182
-
183
-
184
-
185
-
186
-
187
-
188
-
189
-
190
-
191
-
192
-
193
-
194
-
195
-
196
-
197
-
198
-
199
-
200
-
201
-
202
-
203
-
204
-
205
-
206
-
207
-
208
-
209
-
210
-
211
-
212
-
213
-
214
-
215
-
216
-
217
-
218
-
219
-
220
-
221
-
222
-
223
-
224
-
225
-
226
-
227
-
228
-
229
-
230
-
231
-
232
-
233
-
234
-
235
-
236
-
237
-
238
-
239
-
240
-
241
-
242
-
243
-
244
-
245
-
246
-
247
-
248
-
249
-
250
-
251
-
252
-
253
-
254
 |
 |
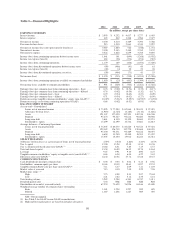
2012 OVERVIEW
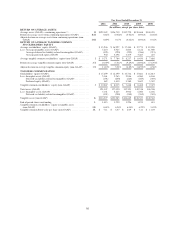
Regions reported net income available to common shareholders of $991 million or $0.71 per diluted
common share in 2012. Credit-related costs, primarily the loan loss provision, declined significantly in 2012 as a
result of improvements in the credit environment. Average low-cost deposits grew 7 percent leading to a decline
in both 2012’s total deposit and funding costs.
Net interest income from continuing operations remained stable at $3.3 billion in 2012. The net interest
margin from continuing operations (taxable- equivalent basis) was 3.11 percent in 2012, compared to
3.07 percent during 2011, primarily due to a reduction in average earning assets. Net interest income was driven
primarily by a decrease of 23 basis points in the cost of interest-bearing liabilities, while being partially offset by
a 15 basis point decline in the overall yield on interest earning assets. This dynamic reflected efforts to improve
deposit costs and pricing on loans, while managing the challenges posed by a low interest rate environment.
Long-term interest rates in particular remained low in 2012, pressuring yields on fixed-rate loan and securities
portfolios, and contributed to the decline in the yield on taxable securities from 3.08 percent in 2011 to
2.55 percent in 2012. The overall costs of deposits improved from 0.49 percent in 2011 to 0.30 percent in 2012,
as short-term interest rates (for example, the Federal Funds rate) remained at historical lows. The product mix of
deposits improved as well, as declines in higher cost certificates of deposits accompanied increases in low cost
checking and savings products.
If current economic conditions persist into 2013, growing net interest income and the resulting net interest
margin will be challenging. However, management believes opportunities exist to stabilize the margin through
further reducing deposit costs and additional liability management actions. Regions’ balance sheet is in a
moderately asset sensitive position such that if economic conditions were to improve more rapidly, thereby
resulting in a rise in interest rates, the net interest margin would likely respond favorably.
Net charge-offs totaled $1.0 billion, or 1.37 percent of average loans in 2012 compared to $2.0 billion, or
2.44 percent of average loans in 2011. Net charge-offs were lower across most major categories when comparing
2012 to the prior year. Non-performing assets decreased $1.1 billion to $1.9 billion at December 31, 2012.
The provision for loan losses is used to maintain the allowance for loan losses at a level that, in
management’s judgment, is appropriate to cover losses inherent in the loan portfolio as of the balance sheet date.
During 2012, the provision for loan losses decreased to $213 million compared to $1.5 billion in 2011. The
allowance for loan losses was $1.9 billion, or 2.59 percent of loans, at December 31, 2012 as compared to
$2.7 billion, or 3.54 percent of loans, at December 31, 2011. Net charge-offs exceeded provision for loan losses
for 2012 due to improving credit metrics, including lower non-accrual, criticized and classified loan balances,
and delinquencies, as well as a decline in overall loan balances.
Non-interest income from continuing operations decreased $43 million to $2.1 billion in 2012 compared to
2011. The year-over-year decrease was due primarily to lower securities gains and service charges, partially
offset by increased mortgage income and investment fee income. See Table 5 “Non-Interest Income” for further
details.
Non-interest expense from continuing operations totaled $3.5 billion and $3.9 billion in 2012 and 2011,
respectively. Non-interest expense included a $253 million goodwill impairment charge in 2011. The 2012
period included an increase in salaries and employee benefits due to higher pension costs, annual merit increases
and incentive increases, including mortgage-related incentives, lower occupancy expense and lower credit-
related costs. See Table 6, “Non-Interest Expense from Continuing Operations” for further details.
Total loans decreased by $3.6 billion, or 4.6 percent in 2012, driven primarily by a continued run-off of
balances related to investor real estate. Decreases in residential first mortgage and home equity loans also
contributed to the year-over-year decrease primarily resulting from consumers’ decisions to de-leverage. These
51