Regions Bank 2012 Annual Report Download - page 181
Download and view the complete annual report
Please find page 181 of the 2012 Regions Bank annual report below. You can navigate through the pages in the report by either clicking on the pages listed below, or by using the keyword search tool below to find specific information within the annual report.-
 1
1 -
2
-
3
-
4
-
5
-
6
-
7
-
8
-
9
-
10
-
11
-
12
-
13
-
14
-
15
-
16
-
17
-
18
-
19
-
20
-
21
-
22
-
23
-
24
-
25
-
26
-
27
-
28
-
29
-
30
-
31
-
32
-
33
-
34
-
35
-
36
-
37
-
38
-
39
-
40
-
41
-
42
-
43
-
44
-
45
-
46
-
47
-
48
-
49
-
50
-
51
-
52
-
53
-
54
-
55
-
56
-
57
-
58
-
59
-
60
-
61
-
62
-
63
-
64
-
65
-
66
-
67
-
68
-
69
-
70
-
71
-
72
-
73
-
74
-
75
-
76
-
77
-
78
-
79
-
80
-
81
-
82
-
83
-
84
-
85
-
86
-
87
-
88
-
89
-
90
-
91
-
92
-
93
-
94
-
95
-
96
-
97
-
98
-
99
-
100
-
101
-
102
-
103
-
104
-
105
-
106
-
107
-
108
-
109
-
110
-
111
-
112
-
113
-
114
-
115
-
116
-
117
-
118
-
119
-
120
-
121
-
122
-
123
-
124
-
125
-
126
-
127
-
128
-
129
-
130
-
131
-
132
-
133
-
134
-
135
-
136
-
137
-
138
-
139
-
140
-
141
-
142
-
143
-
144
-
145
-
146
-
147
-
148
-
149
-
150
-
151
-
152
-
153
-
154
-
155
-
156
-
157
-
158
-
159
-
160
-
161
-
162
-
163
-
164
-
165
-
166
-
167
-
168
-
169
-
170
-
 171
171 -
 172
172 -
 173
173 -
 174
174 -
 175
175 -
 176
176 -
 177
177 -
 178
178 -
 179
179 -
 180
180 -
 181
181 -
 182
182 -
 183
183 -
 184
184 -
 185
185 -
 186
186 -
 187
187 -
 188
188 -
 189
189 -
 190
190 -
 191
191 -
192
-
193
-
194
-
195
-
196
-
197
-
198
-
199
-
200
-
201
-
202
-
203
-
204
-
205
-
206
-
207
-
208
-
209
-
210
-
211
-
212
-
213
-
214
-
215
-
216
-
217
-
218
-
219
-
220
-
221
-
222
-
223
-
224
-
225
-
226
-
227
-
228
-
229
-
230
-
231
-
232
-
233
-
234
-
235
-
236
-
237
-
238
-
239
-
240
-
241
-
242
-
243
-
244
-
245
-
246
-
247
-
248
-
249
-
250
-
251
-
252
-
253
-
254
 |
 |

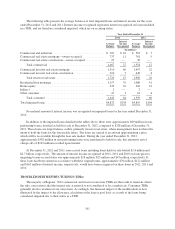
Regions maintains a repurchase liability related to mortgage loans sold with representations and warranty
provisions. This repurchase liability is reported in other liabilities on the consolidated balance sheets and reflects
management’s estimate of losses based on historical repurchase and loss trends, as well as other factors that may
result in anticipated losses different from historical loss trends. Adjustments to this reserve are recorded in other
non-interest expense on the consolidated statements of operations. The table below presents an analysis of
Regions’ repurchase liability related to mortgage loans sold with representations and warranty provisions for the
years ended December 31:
2012 2011
(In millions)
Beginning balance ...................................................... $32 $32
Additions ......................................................... 41 23
Losses ............................................................ (33) (23)
Ending balance ......................................................... $40 $32
During 2012 and 2011, settled repurchase claims were related to one of the following alleged breaches: 1)
underwriting guideline violations; 2) misrepresentation of income, assets or employment; or 3) property
valuation not supported. These claims stem primarily from the 2006-2008 vintages.
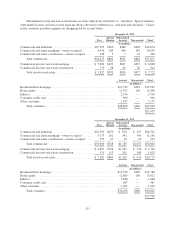
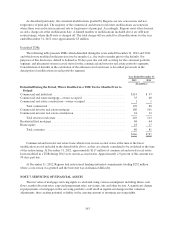
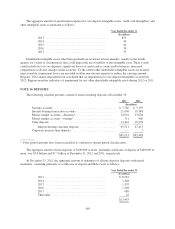
NOTE 8. PREMISES AND EQUIPMENT
A summary of premises and equipment at December 31 is as follows:
2012 2011
(In millions)
Land .................................................... $ 525 $ 492
Premises and improvements .................................. 1,727 1,706
Furniture and equipment ..................................... 1,010 1,106
Software ................................................. 303 279
Leasehold improvements .................................... 396 425
Construction in progress ..................................... 175 188
4,136 4,196
Accumulated depreciation and amortization ..................... (1,857) (1,821)
$ 2,279 $ 2,375
NOTE 9. INTANGIBLE ASSETS
GOODWILL
As further discussed in Note 22, Regions reorganized its management reporting structure during the third
quarter 2012 and, accordingly, its segment reporting structure and goodwill reporting units. In connection with
the reorganization, management reallocated goodwill to the new reporting units using a relative fair value
approach, resulting in amounts detailed as follows:
December 31
2012
(In millions)
Business Services ........................................................ $2,552
Consumer Services ....................................................... 1,797
Wealth Management ...................................................... 467
$4,816
165