Regions Bank 2012 Annual Report Download - page 91
Download and view the complete annual report
Please find page 91 of the 2012 Regions Bank annual report below. You can navigate through the pages in the report by either clicking on the pages listed below, or by using the keyword search tool below to find specific information within the annual report.-
 1
1 -
2
-
3
-
4
-
5
-
6
-
7
-
8
-
9
-
10
-
11
-
12
-
13
-
14
-
15
-
16
-
17
-
18
-
19
-
20
-
21
-
22
-
23
-
24
-
25
-
26
-
27
-
28
-
29
-
30
-
31
-
32
-
33
-
34
-
35
-
36
-
37
-
38
-
39
-
40
-
41
-
42
-
43
-
44
-
45
-
46
-
47
-
48
-
49
-
50
-
51
-
52
-
53
-
54
-
55
-
56
-
57
-
58
-
59
-
60
-
61
-
62
-
63
-
64
-
65
-
66
-
67
-
68
-
69
-
70
-
71
-
72
-
73
-
74
-
75
-
76
-
77
-
78
-
79
-
80
-
 81
81 -
 82
82 -
 83
83 -
 84
84 -
 85
85 -
 86
86 -
 87
87 -
 88
88 -
 89
89 -
 90
90 -
 91
91 -
 92
92 -
 93
93 -
 94
94 -
 95
95 -
 96
96 -
 97
97 -
 98
98 -
 99
99 -
 100
100 -
 101
101 -
102
-
103
-
104
-
105
-
106
-
107
-
108
-
109
-
110
-
111
-
112
-
113
-
114
-
115
-
116
-
117
-
118
-
119
-
120
-
121
-
122
-
123
-
124
-
125
-
126
-
127
-
128
-
129
-
130
-
131
-
132
-
133
-
134
-
135
-
136
-
137
-
138
-
139
-
140
-
141
-
142
-
143
-
144
-
145
-
146
-
147
-
148
-
149
-
150
-
151
-
152
-
153
-
154
-
155
-
156
-
157
-
158
-
159
-
160
-
161
-
162
-
163
-
164
-
165
-
166
-
167
-
168
-
169
-
170
-
171
-
172
-
173
-
174
-
175
-
176
-
177
-
178
-
179
-
180
-
181
-
182
-
183
-
184
-
185
-
186
-
187
-
188
-
189
-
190
-
191
-
192
-
193
-
194
-
195
-
196
-
197
-
198
-
199
-
200
-
201
-
202
-
203
-
204
-
205
-
206
-
207
-
208
-
209
-
210
-
211
-
212
-
213
-
214
-
215
-
216
-
217
-
218
-
219
-
220
-
221
-
222
-
223
-
224
-
225
-
226
-
227
-
228
-
229
-
230
-
231
-
232
-
233
-
234
-
235
-
236
-
237
-
238
-
239
-
240
-
241
-
242
-
243
-
244
-
245
-
246
-
247
-
248
-
249
-
250
-
251
-
252
-
253
-
254
 |
 |

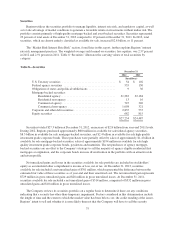
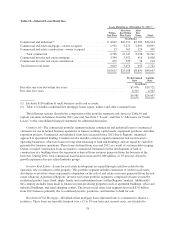
Securities
Regions utilizes the securities portfolio to manage liquidity, interest rate risk, and regulatory capital, as well
as to take advantage of market conditions to generate a favorable return on investments without undue risk. The
portfolio consists primarily of high-quality mortgage-backed and asset-backed securities. Securities represented
22 percent of total assets at December 31, 2012 compared to 19 percent at December 31, 2011. In 2012, total
securities, which are almost entirely classified as available for sale, increased $2.8 billion, or 11 percent.
The “Market Risk-Interest Rate Risk” section, found later in this report, further explains Regions’ interest
rate risk management practices. The weighted-average yield earned on securities, less equities, was 2.57 percent
in 2012 and 2.91 percent in 2011. Table 8 “Securities” illustrates the carrying values of total securities by
category.
Table 8—Securities
December 31
2012 2011
(In millions)
U.S. Treasury securities .................................... $ 54 $ 102
Federal agency securities ................................... 555 150
Obligations of states and political subdivisions .................. 9 36
Mortgage-backed securities:
Residential agency ..................................... 21,283 22,184
Residential non-agency ................................. 13 16
Commercial agency .................................... 725 326
Commercial non-agency ................................ 1,098 321
Corporate and other debt securities ............................ 2,835 537
Equity securities .......................................... 682 815
$27,254 $24,487
Securities totaled $27.3 billion at December 31, 2012, an increase of $2.8 billion from year-end 2011 levels.
During 2012, Regions purchased approximately $600 million in available for sale federal agency securities,
$8.3 billion in available for sale mortgage-backed securities, and $2.4 billion in available for sale high quality
investment grade corporate bonds. These purchases were partially offset by sales of approximately $1.4 billion in
available for sale mortgage-backed securities, sales of approximately $194 million in available for sale high
quality investment grade corporate bonds, paydowns and maturities. The net purchases of agency mortgage-
backed securities are an offset to the Company’s strategy to sell the majority of agency eligible residential first
mortgages at origination, and the corporate bonds increase diversification in the portfolio with an attractive risk
and return profile.
Net unrealized gains and losses in the securities available for sale portfolio are included in stockholders’
equity as accumulated other comprehensive income or loss, net of tax. At December 31, 2012, securities
available for sale included a net unrealized gain of $701 million, which represented the difference between the
estimated fair value of these securities as of year-end and their amortized cost. The net unrealized gain represents
$729 million in gross unrealized gains and $28 million in gross unrealized losses. At December 31, 2011,
securities available for sale included a net unrealized gain of $514 million, comprised of $532 million in gross
unrealized gains and $18 million in gross unrealized losses.
The Company reviews its securities portfolio on a regular basis to determine if there are any conditions
indicating that a security has other-than-temporary impairment. Factors considered in this determination include
the length of time and the extent to which the market value has been below cost, the credit standing of the issuer,
Regions’ intent to sell and whether it is more likely than not that the Company will have to sell the security
75