Regions Bank 2012 Annual Report Download - page 69
Download and view the complete annual report
Please find page 69 of the 2012 Regions Bank annual report below. You can navigate through the pages in the report by either clicking on the pages listed below, or by using the keyword search tool below to find specific information within the annual report.-
 1
1 -
2
-
3
-
4
-
5
-
6
-
7
-
8
-
9
-
10
-
11
-
12
-
13
-
14
-
15
-
16
-
17
-
18
-
19
-
20
-
21
-
22
-
23
-
24
-
25
-
26
-
27
-
28
-
29
-
30
-
31
-
32
-
33
-
34
-
35
-
36
-
37
-
38
-
39
-
40
-
41
-
42
-
43
-
44
-
45
-
46
-
47
-
48
-
49
-
50
-
51
-
52
-
53
-
54
-
55
-
56
-
57
-
58
-
 59
59 -
 60
60 -
 61
61 -
 62
62 -
 63
63 -
 64
64 -
 65
65 -
 66
66 -
 67
67 -
 68
68 -
 69
69 -
 70
70 -
 71
71 -
 72
72 -
 73
73 -
 74
74 -
 75
75 -
 76
76 -
 77
77 -
 78
78 -
 79
79 -
80
-
81
-
82
-
83
-
84
-
85
-
86
-
87
-
88
-
89
-
90
-
91
-
92
-
93
-
94
-
95
-
96
-
97
-
98
-
99
-
100
-
101
-
102
-
103
-
104
-
105
-
106
-
107
-
108
-
109
-
110
-
111
-
112
-
113
-
114
-
115
-
116
-
117
-
118
-
119
-
120
-
121
-
122
-
123
-
124
-
125
-
126
-
127
-
128
-
129
-
130
-
131
-
132
-
133
-
134
-
135
-
136
-
137
-
138
-
139
-
140
-
141
-
142
-
143
-
144
-
145
-
146
-
147
-
148
-
149
-
150
-
151
-
152
-
153
-
154
-
155
-
156
-
157
-
158
-
159
-
160
-
161
-
162
-
163
-
164
-
165
-
166
-
167
-
168
-
169
-
170
-
171
-
172
-
173
-
174
-
175
-
176
-
177
-
178
-
179
-
180
-
181
-
182
-
183
-
184
-
185
-
186
-
187
-
188
-
189
-
190
-
191
-
192
-
193
-
194
-
195
-
196
-
197
-
198
-
199
-
200
-
201
-
202
-
203
-
204
-
205
-
206
-
207
-
208
-
209
-
210
-
211
-
212
-
213
-
214
-
215
-
216
-
217
-
218
-
219
-
220
-
221
-
222
-
223
-
224
-
225
-
226
-
227
-
228
-
229
-
230
-
231
-
232
-
233
-
234
-
235
-
236
-
237
-
238
-
239
-
240
-
241
-
242
-
243
-
244
-
245
-
246
-
247
-
248
-
249
-
250
-
251
-
252
-
253
-
254
 |
 |
assessment of the capital adequacy of a bank based on a variation of Tier 1 capital, known as Tier 1 common
equity. While not prescribed in amount by federal banking regulations, analysts and banking regulators have
assessed Regions’ capital adequacy using the tangible common stockholders’ equity and/or the Tier 1 common
equity measure. Because tangible common stockholders’ equity and Tier 1 common equity are not formally
defined by GAAP or prescribed in amount by federal banking regulations, these measures are considered to be
non-GAAP financial measures and other entities may calculate them differently than Regions’ disclosed
calculations. Since analysts and banking regulators may assess Regions’ capital adequacy using tangible common
stockholders’ equity and Tier 1 common equity, Regions believes that it is useful to provide investors the ability
to assess Regions’ capital adequacy on these same bases.
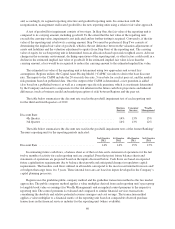
Tier 1 common equity is often expressed as a percentage of risk-weighted assets. Under the risk-based
capital framework, a bank’s balance sheet assets and credit equivalent amounts of off-balance sheet items are
assigned to one of four broad risk categories. The aggregated dollar amount in each category is then multiplied
by the risk weighting assigned to that category. The resulting weighted values from each of the four categories
are added together and this sum is the risk-weighted assets total that, as adjusted, comprises the denominator of
certain risk-based capital ratios. Tier 1 capital is then divided by this denominator (risk-weighted assets) to
determine the Tier 1 capital ratio. Adjustments are made to Tier 1 capital to arrive at Tier 1 common equity (non-
GAAP). Tier 1 common equity is also divided by the risk-weighted assets to determine the Tier 1 common equity
ratio. The amounts disclosed as risk-weighted assets are calculated consistent with banking regulatory
requirements.
Regions currently calculates its risk-based capital ratios under guidelines adopted by the Federal Reserve
based on the 1988 Capital Accord (“Basel I”) of the Basel Committee on Banking Supervision (the “Basel
Committee”). In December 2010, the Basel Committee released its final framework for Basel III, which will
strengthen international capital and liquidity regulations. When implemented by U.S. bank regulatory agencies
and fully phased-in, Basel III will change capital requirements and place greater emphasis on common equity.
The Federal Reserve has announced a delay in the implementation date of the final rules. However, when
implemented there will be a phase in period of up to 6 years. The U.S. bank regulatory agencies have not yet
finalized regulations governing the implementation of Basel III. Accordingly, the calculations provided below
are estimates, based on Regions’ current understanding of the framework, including the Company’s reading of
the original requirements, as well as the U.S. Notices of Proposed Rulemaking (“NPR”) released in June 2012,
and informal feedback received through the regulatory process. Regions’ understanding of the framework is
evolving and will likely change as the regulations are finalized. The NPR comment period ended in October
2012; changes to the calculation resulting from the comment process could result in materially different capital
ratios from the amounts estimated. Because the Basel III implementation regulations are not formally defined by
GAAP and have not yet been finalized and codified, these measures are considered to be non-GAAP financial
measures, and other entities may calculate them differently from Regions’ disclosed calculations. Since analysts
and banking regulators may assess Regions’ capital adequacy using the Basel III framework, Regions believes
that it is useful to provide investors information enabling them to assess Regions’ capital adequacy on the same
basis.
Non-GAAP financial measures have inherent limitations, are not required to be uniformly applied and are
not audited. Although these non-GAAP financial measures are frequently used by stakeholders in the evaluation
of a company, they have limitations as analytical tools, and should not be considered in isolation, or as a
substitute for analyses of results as reported under GAAP. In particular, a measure of earnings that excludes
selected items does not represent the amount that effectively accrues directly to stockholders (i.e., REIT
investment early termination costs, merger-related charges, goodwill impairment and regulatory charge and
related tax benefit are a reduction to earnings and stockholders’ equity).
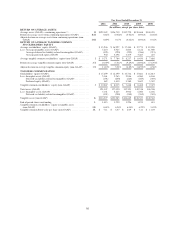
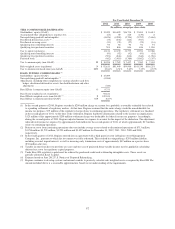
The following tables provide: 1) a reconciliation of net income (loss) (GAAP) to income (loss) available to
common shareholders (GAAP), 2) a reconciliation of net income (loss) available to common shareholders
(GAAP) to income (loss) from continuing operations available to common shareholders (GAAP), 3) a
53