Regions Bank 2012 Annual Report Download - page 106
Download and view the complete annual report
Please find page 106 of the 2012 Regions Bank annual report below. You can navigate through the pages in the report by either clicking on the pages listed below, or by using the keyword search tool below to find specific information within the annual report.-
 1
1 -
2
-
3
-
4
-
5
-
6
-
7
-
8
-
9
-
10
-
11
-
12
-
13
-
14
-
15
-
16
-
17
-
18
-
19
-
20
-
21
-
22
-
23
-
24
-
25
-
26
-
27
-
28
-
29
-
30
-
31
-
32
-
33
-
34
-
35
-
36
-
37
-
38
-
39
-
40
-
41
-
42
-
43
-
44
-
45
-
46
-
47
-
48
-
49
-
50
-
51
-
52
-
53
-
54
-
55
-
56
-
57
-
58
-
59
-
60
-
61
-
62
-
63
-
64
-
65
-
66
-
67
-
68
-
69
-
70
-
71
-
72
-
73
-
74
-
75
-
76
-
77
-
78
-
79
-
80
-
81
-
82
-
83
-
84
-
85
-
86
-
87
-
88
-
89
-
90
-
91
-
92
-
93
-
94
-
95
-
 96
96 -
 97
97 -
 98
98 -
 99
99 -
 100
100 -
 101
101 -
 102
102 -
 103
103 -
 104
104 -
 105
105 -
 106
106 -
 107
107 -
 108
108 -
 109
109 -
 110
110 -
 111
111 -
 112
112 -
 113
113 -
 114
114 -
 115
115 -
 116
116 -
117
-
118
-
119
-
120
-
121
-
122
-
123
-
124
-
125
-
126
-
127
-
128
-
129
-
130
-
131
-
132
-
133
-
134
-
135
-
136
-
137
-
138
-
139
-
140
-
141
-
142
-
143
-
144
-
145
-
146
-
147
-
148
-
149
-
150
-
151
-
152
-
153
-
154
-
155
-
156
-
157
-
158
-
159
-
160
-
161
-
162
-
163
-
164
-
165
-
166
-
167
-
168
-
169
-
170
-
171
-
172
-
173
-
174
-
175
-
176
-
177
-
178
-
179
-
180
-
181
-
182
-
183
-
184
-
185
-
186
-
187
-
188
-
189
-
190
-
191
-
192
-
193
-
194
-
195
-
196
-
197
-
198
-
199
-
200
-
201
-
202
-
203
-
204
-
205
-
206
-
207
-
208
-
209
-
210
-
211
-
212
-
213
-
214
-
215
-
216
-
217
-
218
-
219
-
220
-
221
-
222
-
223
-
224
-
225
-
226
-
227
-
228
-
229
-
230
-
231
-
232
-
233
-
234
-
235
-
236
-
237
-
238
-
239
-
240
-
241
-
242
-
243
-
244
-
245
-
246
-
247
-
248
-
249
-
250
-
251
-
252
-
253
-
254
 |
 |

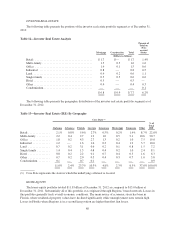
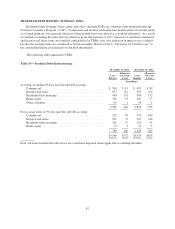
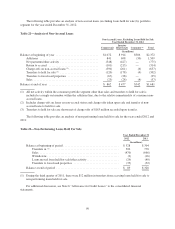
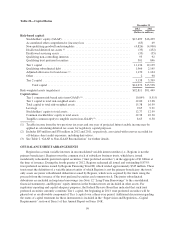
The following table provides an analysis of non-accrual loans (excluding loans held for sale) by portfolio
segment for the year ended December 31, 2012:
Table 21—Analysis of Non-Accrual Loans
Non-Accrual Loans, Excluding Loans Held for Sale
Year Ended December 31, 2012
Commercial
Investor
Real Estate Consumer (1) Total
(In millions)
Balance at beginning of year ............................. $1,072 $ 914 $386 $2,372
Additions ........................................ 841 698 (30) 1,509
Net payments/other activity .......................... (348) (427) — (775)
Return to accrual .................................. (101) (213) — (314)
Charge-offs on non-accrual loans (2) .................... (390) (261) (6) (657)
Transfers to held for sale (3) .......................... (120) (178) (4) (302)
Transfers to foreclosed properties ..................... (67) (28) — (95)
Sales ............................................ (25) (28) (4) (57)
Balance at end of year .................................. $ 862 $477 $342 $1,681
(1) All net activity within the consumer portfolio segment other than sales and transfers to held for sale is
included as a single net number within the additions line, due to the relative immateriality of consumer non-
accrual loans.
(2) Includes charge-offs on loans on non-accrual status and charge-offs taken upon sale and transfer of non-
accrual loans to held for sale.
(3) Transfers to held for sale are shown net of charge-offs of $163 million recorded upon transfer.
The following table provides an analysis of non-performing loans held for sale for the years ended 2012 and
2011:
Table 22—Non-Performing Loans Held For Sale
Year Ended December 31
2012 2011
(In millions)
Balance at beginning of period ...................................... $328 $304
Transfers in (1) ............................................... 302 778
Sales ...................................................... (470) (666)
Writedowns ................................................. (9) (16)
Loans moved from held for sale/other activity ...................... (29) (40)
Transfers to foreclosed properties ............................... (33) (32)
Balance at end of period ........................................... $ 89 $328
(1) During the third quarter of 2011, there were $12 million in transfers from accruing loans held for sale to
non-performing loans held for sale.
For additional discussion, see Note 6 “Allowance for Credit Losses” to the consolidated financial
statements.
90