Regions Bank 2012 Annual Report Download - page 178
Download and view the complete annual report
Please find page 178 of the 2012 Regions Bank annual report below. You can navigate through the pages in the report by either clicking on the pages listed below, or by using the keyword search tool below to find specific information within the annual report.-
 1
1 -
2
-
3
-
4
-
5
-
6
-
7
-
8
-
9
-
10
-
11
-
12
-
13
-
14
-
15
-
16
-
17
-
18
-
19
-
20
-
21
-
22
-
23
-
24
-
25
-
26
-
27
-
28
-
29
-
30
-
31
-
32
-
33
-
34
-
35
-
36
-
37
-
38
-
39
-
40
-
41
-
42
-
43
-
44
-
45
-
46
-
47
-
48
-
49
-
50
-
51
-
52
-
53
-
54
-
55
-
56
-
57
-
58
-
59
-
60
-
61
-
62
-
63
-
64
-
65
-
66
-
67
-
68
-
69
-
70
-
71
-
72
-
73
-
74
-
75
-
76
-
77
-
78
-
79
-
80
-
81
-
82
-
83
-
84
-
85
-
86
-
87
-
88
-
89
-
90
-
91
-
92
-
93
-
94
-
95
-
96
-
97
-
98
-
99
-
100
-
101
-
102
-
103
-
104
-
105
-
106
-
107
-
108
-
109
-
110
-
111
-
112
-
113
-
114
-
115
-
116
-
117
-
118
-
119
-
120
-
121
-
122
-
123
-
124
-
125
-
126
-
127
-
128
-
129
-
130
-
131
-
132
-
133
-
134
-
135
-
136
-
137
-
138
-
139
-
140
-
141
-
142
-
143
-
144
-
145
-
146
-
147
-
148
-
149
-
150
-
151
-
152
-
153
-
154
-
155
-
156
-
157
-
158
-
159
-
160
-
161
-
162
-
163
-
164
-
165
-
166
-
167
-
 168
168 -
 169
169 -
 170
170 -
 171
171 -
 172
172 -
 173
173 -
 174
174 -
 175
175 -
 176
176 -
 177
177 -
 178
178 -
 179
179 -
 180
180 -
 181
181 -
 182
182 -
 183
183 -
 184
184 -
 185
185 -
 186
186 -
 187
187 -
 188
188 -
189
-
190
-
191
-
192
-
193
-
194
-
195
-
196
-
197
-
198
-
199
-
200
-
201
-
202
-
203
-
204
-
205
-
206
-
207
-
208
-
209
-
210
-
211
-
212
-
213
-
214
-
215
-
216
-
217
-
218
-
219
-
220
-
221
-
222
-
223
-
224
-
225
-
226
-
227
-
228
-
229
-
230
-
231
-
232
-
233
-
234
-
235
-
236
-
237
-
238
-
239
-
240
-
241
-
242
-
243
-
244
-
245
-
246
-
247
-
248
-
249
-
250
-
251
-
252
-
253
-
254
 |
 |

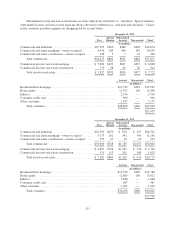
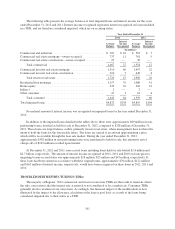
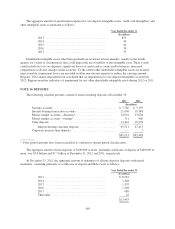
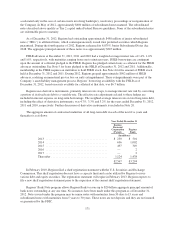
None of the modified consumer loans listed in the following TDR disclosures were collateral-dependent at
the time of modification. At December 31, 2012, approximately $129 million in residential first mortgage TDRs
were in excess of 180 days past due and are considered collateral-dependent. At December 31, 2012
approximately $11 million in home equity first lien TDRs were in excess of 180 days past due and $8 million in
home equity second lien TDRs were in excess of 120 days past due and are considered collateral-dependent.
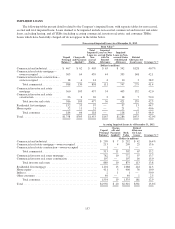
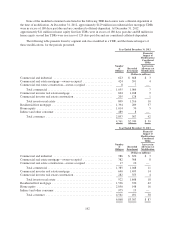
The following table presents loans by segment and class modified in a TDR, and the financial impact of
those modifications, for the periods presented.
Year Ended December 31, 2012
Financial
Impact of
Modifications
Considered
TDRs
Number
of
Obligors
Recorded
Investment
Increase in
Allowance at
Modification
(Dollars in millions)
Commercial and industrial ........................................ 623 $ 668 $ 3
Commercial real estate mortgage—owner-occupied .................... 424 391 4
Commercial real estate construction—owner-occupied .................. 8 7 —
Total commercial ............................................ 1,055 1,066 7
Commercial investor real estate mortgage ............................ 604 1,188 9
Commercial investor real estate construction .......................... 205 128 1
Total investor real estate ...................................... 809 1,316 10
Residential first mortgage ......................................... 1,394 289 37
Home equity ................................................... 1,014 70 5
Indirect and other consumer ....................................... 489 8 —
Total consumer ............................................. 2,897 367 42
4,761 $2,749 $ 59
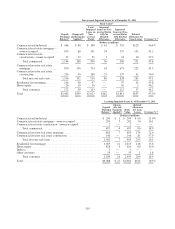
Year Ended December 31, 2011
Financial
Impact of
Modifications
Considered
TDRs
Number
of
Obligors
Recorded
Investment
Increase in
Allowance at
Modification
(Dollars in millions)
Commercial and industrial ........................................ 986 $ 670 $ 3
Commercial real estate mortgage—owner-occupied .................... 382 368 8
Commercial real estate construction—owner-occupied .................. 17 10 —
Total commercial ............................................ 1,385 1,048 11
Commercial investor real estate mortgage ............................ 640 1,493 14
Commercial investor real estate construction .......................... 282 355 4
Total investor real estate ...................................... 922 1,848 18
Residential first mortgage ......................................... 1,536 330 42
Home equity ................................................... 2,050 148 16
Indirect and other consumer ....................................... 975 13 —
Total consumer ............................................. 4,561 491 58
6,868 $3,387 $ 87
162