Regions Bank 2012 Annual Report Download - page 209
Download and view the complete annual report
Please find page 209 of the 2012 Regions Bank annual report below. You can navigate through the pages in the report by either clicking on the pages listed below, or by using the keyword search tool below to find specific information within the annual report.-
 1
1 -
2
-
3
-
4
-
5
-
6
-
7
-
8
-
9
-
10
-
11
-
12
-
13
-
14
-
15
-
16
-
17
-
18
-
19
-
20
-
21
-
22
-
23
-
24
-
25
-
26
-
27
-
28
-
29
-
30
-
31
-
32
-
33
-
34
-
35
-
36
-
37
-
38
-
39
-
40
-
41
-
42
-
43
-
44
-
45
-
46
-
47
-
48
-
49
-
50
-
51
-
52
-
53
-
54
-
55
-
56
-
57
-
58
-
59
-
60
-
61
-
62
-
63
-
64
-
65
-
66
-
67
-
68
-
69
-
70
-
71
-
72
-
73
-
74
-
75
-
76
-
77
-
78
-
79
-
80
-
81
-
82
-
83
-
84
-
85
-
86
-
87
-
88
-
89
-
90
-
91
-
92
-
93
-
94
-
95
-
96
-
97
-
98
-
99
-
100
-
101
-
102
-
103
-
104
-
105
-
106
-
107
-
108
-
109
-
110
-
111
-
112
-
113
-
114
-
115
-
116
-
117
-
118
-
119
-
120
-
121
-
122
-
123
-
124
-
125
-
126
-
127
-
128
-
129
-
130
-
131
-
132
-
133
-
134
-
135
-
136
-
137
-
138
-
139
-
140
-
141
-
142
-
143
-
144
-
145
-
146
-
147
-
148
-
149
-
150
-
151
-
152
-
153
-
154
-
155
-
156
-
157
-
158
-
159
-
160
-
161
-
162
-
163
-
164
-
165
-
166
-
167
-
168
-
169
-
170
-
171
-
172
-
173
-
174
-
175
-
176
-
177
-
178
-
179
-
180
-
181
-
182
-
183
-
184
-
185
-
186
-
187
-
188
-
189
-
190
-
191
-
192
-
193
-
194
-
195
-
196
-
197
-
198
-
 199
199 -
 200
200 -
 201
201 -
 202
202 -
 203
203 -
 204
204 -
 205
205 -
 206
206 -
 207
207 -
 208
208 -
 209
209 -
 210
210 -
 211
211 -
 212
212 -
 213
213 -
 214
214 -
 215
215 -
 216
216 -
 217
217 -
 218
218 -
 219
219 -
220
-
221
-
222
-
223
-
224
-
225
-
226
-
227
-
228
-
229
-
230
-
231
-
232
-
233
-
234
-
235
-
236
-
237
-
238
-
239
-
240
-
241
-
242
-
243
-
244
-
245
-
246
-
247
-
248
-
249
-
250
-
251
-
252
-
253
-
254
 |
 |

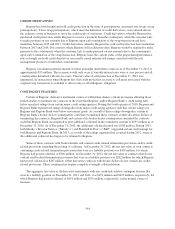
DERIVATIVES NOT DESIGNATED AS HEDGING INSTRUMENTS
The Company maintains a derivatives trading portfolio of interest rate swaps, option contracts, and futures
and forward commitments used to meet the needs of its customers. The portfolio is used to generate trading profit
and to help clients manage market risk. The Company is subject to the credit risk that a counterparty will fail to
perform. The Company is also subject to market risk, which is evaluated by the Company and monitored by the
asset/liability management process. Separate derivative contracts are entered into to reduce overall market
exposure to pre-defined limits. The contracts in this portfolio do not qualify for hedge accounting and are
marked-to-market through earnings and included in other assets and other liabilities.
Regions enters into interest rate lock commitments, which are commitments to originate mortgage loans
whereby the interest rate on the loan is determined prior to funding and the customers have locked into that
interest rate. At December 31, 2012 and 2011, Regions had $775 million and $559 million, respectively, in total
notional amount of rate lock commitments. Regions manages market risk on interest rate lock commitments and
mortgage loans held for sale with corresponding forward sale commitments, which are recorded at fair value with
changes in fair value recorded in mortgage income. At December 31, 2012 and 2011, Regions had $1.9 billion
and $1.3 billion, respectively, in total absolute notional amount related to these forward rate commitments.
Regions has elected to account for mortgage servicing rights at fair market value with any changes to fair
value being recorded within mortgage income. Concurrent with the election to use the fair value measurement
method, Regions began using various derivative instruments, in the form of forward rate commitments, futures
contracts, swaps and swaptions to mitigate the statement of operations effect of changes in the fair value of its
mortgage servicing rights. As of December 31, 2012 and 2011, the total notional amount related to these
contracts was $4.7 billion and $5.1 billion, respectively.
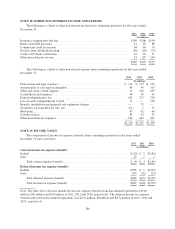
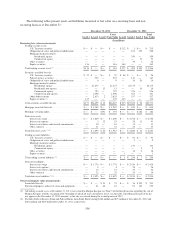
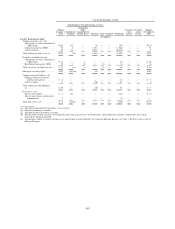
The following table presents the location and amount of gain or (loss) recognized in income on derivatives
not designated as hedging instruments in the statements of operations for the years ended December 31:
Derivatives Not Designated as Hedging Instruments 2012 2011 2010
(In millions)
Investment fee income
Interest rate swaps ...................................................... $ 29 $ 11 $(10)
Interest rate options ..................................................... (1) (3) 3
Interest rate futures and forward commitments ................................ (1) (1) (3)
Other contracts ......................................................... 10 11 11
Total investment fee income .................................................. 37 18 1
Mortgage income
Interest rate swaps ...................................................... 28 80 18
Interest rate options ..................................................... 7 2 (4)
Interest rate futures and forward commitments ................................ 35 18 74
Total mortgage income ...................................................... 70 100 88
$107 $118 $ 89
Credit risk, defined as all positive exposures not collateralized with cash or other assets, totaled
approximately $713 million and $924 million at December 31, 2012 and 2011, respectively. This amount
represents the net credit risk on all trading and other derivative positions held by Regions.
193