Regions Bank 2012 Annual Report Download - page 183
Download and view the complete annual report
Please find page 183 of the 2012 Regions Bank annual report below. You can navigate through the pages in the report by either clicking on the pages listed below, or by using the keyword search tool below to find specific information within the annual report.-
 1
1 -
2
-
3
-
4
-
5
-
6
-
7
-
8
-
9
-
10
-
11
-
12
-
13
-
14
-
15
-
16
-
17
-
18
-
19
-
20
-
21
-
22
-
23
-
24
-
25
-
26
-
27
-
28
-
29
-
30
-
31
-
32
-
33
-
34
-
35
-
36
-
37
-
38
-
39
-
40
-
41
-
42
-
43
-
44
-
45
-
46
-
47
-
48
-
49
-
50
-
51
-
52
-
53
-
54
-
55
-
56
-
57
-
58
-
59
-
60
-
61
-
62
-
63
-
64
-
65
-
66
-
67
-
68
-
69
-
70
-
71
-
72
-
73
-
74
-
75
-
76
-
77
-
78
-
79
-
80
-
81
-
82
-
83
-
84
-
85
-
86
-
87
-
88
-
89
-
90
-
91
-
92
-
93
-
94
-
95
-
96
-
97
-
98
-
99
-
100
-
101
-
102
-
103
-
104
-
105
-
106
-
107
-
108
-
109
-
110
-
111
-
112
-
113
-
114
-
115
-
116
-
117
-
118
-
119
-
120
-
121
-
122
-
123
-
124
-
125
-
126
-
127
-
128
-
129
-
130
-
131
-
132
-
133
-
134
-
135
-
136
-
137
-
138
-
139
-
140
-
141
-
142
-
143
-
144
-
145
-
146
-
147
-
148
-
149
-
150
-
151
-
152
-
153
-
154
-
155
-
156
-
157
-
158
-
159
-
160
-
161
-
162
-
163
-
164
-
165
-
166
-
167
-
168
-
169
-
170
-
171
-
172
-
 173
173 -
 174
174 -
 175
175 -
 176
176 -
 177
177 -
 178
178 -
 179
179 -
 180
180 -
 181
181 -
 182
182 -
 183
183 -
 184
184 -
 185
185 -
 186
186 -
 187
187 -
 188
188 -
 189
189 -
 190
190 -
 191
191 -
 192
192 -
 193
193 -
194
-
195
-
196
-
197
-
198
-
199
-
200
-
201
-
202
-
203
-
204
-
205
-
206
-
207
-
208
-
209
-
210
-
211
-
212
-
213
-
214
-
215
-
216
-
217
-
218
-
219
-
220
-
221
-
222
-
223
-
224
-
225
-
226
-
227
-
228
-
229
-
230
-
231
-
232
-
233
-
234
-
235
-
236
-
237
-
238
-
239
-
240
-
241
-
242
-
243
-
244
-
245
-
246
-
247
-
248
-
249
-
250
-
251
-
252
-
253
-
254
 |
 |

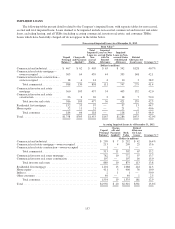
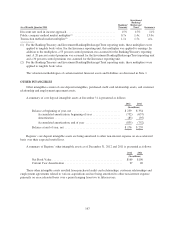
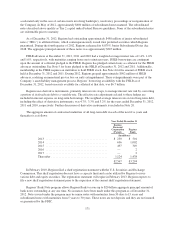
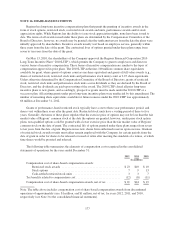
As of Fourth Quarter 2011
Banking/
Treasury
Investment
Banking/
Brokerage/
Trust Insurance
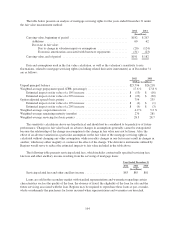
Discount rate used in income approach ................................. 15% 15% 11%
Public company method market multiplier(1) ............................ 0.7x 1.4x 13.0x
Transaction method market multiplier(2) ................................ 1.1x 1.5x n/a
(1) For the Banking/Treasury and Investment Banking/Brokerage/Trust reporting units, these multipliers were
applied to tangible book value. For the Insurance reporting unit, this multiplier was applied to earnings. In
addition to the multipliers, a 55 percent control premium was assumed for the Banking/Treasury reporting
unit. A 20 percent control premium was assumed for the Investment Banking/Brokerage/Trust reporting unit
and a 30 percent control premium was assumed for the Insurance reporting unit.
(2) For the Banking/Treasury and Investment Banking/Brokerage/Trust reporting units, these multipliers were
applied to tangible book value.
The valuation methodologies of certain material financial assets and liabilities are discussed in Note 1.
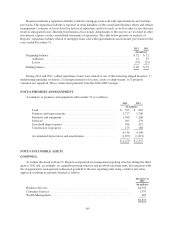
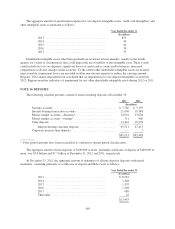
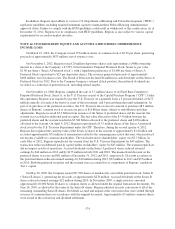
OTHER INTANGIBLES
Other intangibles consist of core deposit intangibles, purchased credit card relationship assets, and customer
relationship and employment agreement assets.
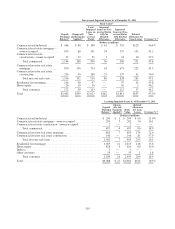
A summary of core deposit intangible assets at December 31 is presented as follows:
2012 2011
(In millions)
Balance at beginning of year, net ................................. $259 $354
Accumulated amortization, beginning of year ................... (752) (657)
Amortization ............................................. (83) (95)
Accumulated amortization, end of year ........................ (835) (752)
Balance at end of year, net ...................................... $176 $259
Regions’ core deposit intangible assets are being amortized to other non-interest expense on an accelerated
basis over their expected useful lives.
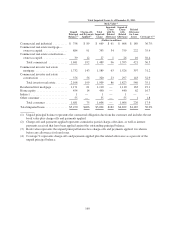
A summary of Regions’ other intangible assets as of December 31, 2012 and 2011 is presented as follows:
2012 2011
(In millions)
Net Book Value ................................................ $169 $190
Current Year Amortization ....................................... 27 20
These other intangible assets resulted from purchased credit card relationships, customer relationships and
employment agreements related to various acquisitions and are being amortized to other non-interest expense
primarily on an accelerated basis over a period ranging from two to fifteen years.
167