Regions Bank 2012 Annual Report Download - page 82
Download and view the complete annual report
Please find page 82 of the 2012 Regions Bank annual report below. You can navigate through the pages in the report by either clicking on the pages listed below, or by using the keyword search tool below to find specific information within the annual report.-
 1
1 -
2
-
3
-
4
-
5
-
6
-
7
-
8
-
9
-
10
-
11
-
12
-
13
-
14
-
15
-
16
-
17
-
18
-
19
-
20
-
21
-
22
-
23
-
24
-
25
-
26
-
27
-
28
-
29
-
30
-
31
-
32
-
33
-
34
-
35
-
36
-
37
-
38
-
39
-
40
-
41
-
42
-
43
-
44
-
45
-
46
-
47
-
48
-
49
-
50
-
51
-
52
-
53
-
54
-
55
-
56
-
57
-
58
-
59
-
60
-
61
-
62
-
63
-
64
-
65
-
66
-
67
-
68
-
69
-
70
-
71
-
 72
72 -
 73
73 -
 74
74 -
 75
75 -
 76
76 -
 77
77 -
 78
78 -
 79
79 -
 80
80 -
 81
81 -
 82
82 -
 83
83 -
 84
84 -
 85
85 -
 86
86 -
 87
87 -
 88
88 -
 89
89 -
 90
90 -
 91
91 -
 92
92 -
93
-
94
-
95
-
96
-
97
-
98
-
99
-
100
-
101
-
102
-
103
-
104
-
105
-
106
-
107
-
108
-
109
-
110
-
111
-
112
-
113
-
114
-
115
-
116
-
117
-
118
-
119
-
120
-
121
-
122
-
123
-
124
-
125
-
126
-
127
-
128
-
129
-
130
-
131
-
132
-
133
-
134
-
135
-
136
-
137
-
138
-
139
-
140
-
141
-
142
-
143
-
144
-
145
-
146
-
147
-
148
-
149
-
150
-
151
-
152
-
153
-
154
-
155
-
156
-
157
-
158
-
159
-
160
-
161
-
162
-
163
-
164
-
165
-
166
-
167
-
168
-
169
-
170
-
171
-
172
-
173
-
174
-
175
-
176
-
177
-
178
-
179
-
180
-
181
-
182
-
183
-
184
-
185
-
186
-
187
-
188
-
189
-
190
-
191
-
192
-
193
-
194
-
195
-
196
-
197
-
198
-
199
-
200
-
201
-
202
-
203
-
204
-
205
-
206
-
207
-
208
-
209
-
210
-
211
-
212
-
213
-
214
-
215
-
216
-
217
-
218
-
219
-
220
-
221
-
222
-
223
-
224
-
225
-
226
-
227
-
228
-
229
-
230
-
231
-
232
-
233
-
234
-
235
-
236
-
237
-
238
-
239
-
240
-
241
-
242
-
243
-
244
-
245
-
246
-
247
-
248
-
249
-
250
-
251
-
252
-
253
-
254
 |
 |

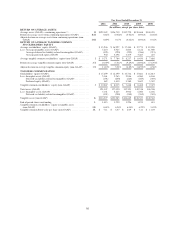
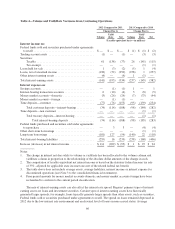
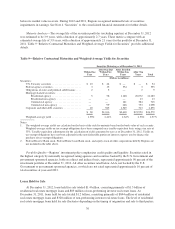
Table 4—Volume and Yield/Rate Variances from Continuing Operations
2012 Compared to 2011 2011 Compared to 2010
Change Due to Change Due to
Volume
Yield/
Rate Net Volume
Yield/
Rate Net
(Taxable-equivalent basis—in millions)
Interest income on:
Federal funds sold and securities purchased under agreements
to resell ......................................... $— $— $— $ (1) $ (1) $ (2)
Trading account assets ............................... (1) — (1) — (3) (3)
Securities:
Taxable ....................................... 61 (138) (77) 26 (141) (115)
Tax-exempt .................................... — — — — (1) (1)
Loans held for sale .................................. 1 (3) (2) (5) 1 (4)
Loans, net of unearned income ......................... (198) (52) (250) (258) 1 (257)
Other interest-earning assets ........................... (4) — (4) 1 (1) —
Total interest-earning assets ........................... (141) (193) (334) (237) (145) (382)
Interest expense on:
Savings accounts .................................... — (1) (1) 1 — 1
Interest-bearing transaction accounts .................... 6 (10) (4) 3 (8) (5)
Money market accounts—domestic ..................... (3) (26) (29) (7) (37) (44)
Money market accounts—foreign ...................... — (1) (1) — — —
Time deposits—customer ............................. (77) (76) (153) (95) (139) (234)
Total customer deposits—interest-bearing ............ (74) (114) (188) (98) (184) (282)
Time deposits—non customer ......................... — — — — (1) (1)
Total treasury deposits—interest-bearing ............. — — — — (1) (1)
Total interest-bearing deposits ................. (74) (114) (188) (98) (185) (283)
Federal funds purchased and securities sold under agreements
to repurchase ..................................... — 3 3 — (4) (4)
Other short-term borrowings .......................... — — — — (1) (1)
Long-term borrowings ............................... (181) 127 (54) (140) 22 (118)
Total interest-bearing liabilities ........................ (255) 16 (239) (238) (168) (406)
Increase (decrease) in net interest income ................ $114 (209) $ (95) $ 1 $ 23 $ 24
Notes:
1. The change in interest not due solely to volume or yield/rate has been allocated to the volume column and
yield/rate column in proportion to the relationship of the absolute dollar amounts of the change in each.
2. The computation of taxable-equivalent net interest income is based on the statutory federal income tax rate
of 35%, adjusted for applicable state income taxes net of the related federal tax benefit.
3. The table above does not include average assets, average liabilities, interest income or interest expense for
discontinued operations (see Note 3 to the consolidated financial statements).
4. Prior period amounts for money market accounts-domestic and money market accounts-foreign have been
reclassified to conform to the current period classification.
The mix of interest-earning assets can also affect the interest rate spread. Regions’ primary types of interest-
earning assets are loans and investment securities. Certain types of interest-earning assets have historically
generated larger spreads; for example, loans typically generate larger spreads than other assets, such as securities,
Federal funds sold or securities purchased under agreements to resell. The spread on loans remained depressed in
2012 due to the low interest rate environment and an elevated level of loans on non-accrual status. Average
66