Regions Bank 2012 Annual Report Download - page 110
Download and view the complete annual report
Please find page 110 of the 2012 Regions Bank annual report below. You can navigate through the pages in the report by either clicking on the pages listed below, or by using the keyword search tool below to find specific information within the annual report.-
 1
1 -
2
-
3
-
4
-
5
-
6
-
7
-
8
-
9
-
10
-
11
-
12
-
13
-
14
-
15
-
16
-
17
-
18
-
19
-
20
-
21
-
22
-
23
-
24
-
25
-
26
-
27
-
28
-
29
-
30
-
31
-
32
-
33
-
34
-
35
-
36
-
37
-
38
-
39
-
40
-
41
-
42
-
43
-
44
-
45
-
46
-
47
-
48
-
49
-
50
-
51
-
52
-
53
-
54
-
55
-
56
-
57
-
58
-
59
-
60
-
61
-
62
-
63
-
64
-
65
-
66
-
67
-
68
-
69
-
70
-
71
-
72
-
73
-
74
-
75
-
76
-
77
-
78
-
79
-
80
-
81
-
82
-
83
-
84
-
85
-
86
-
87
-
88
-
89
-
90
-
91
-
92
-
93
-
94
-
95
-
96
-
97
-
98
-
99
-
 100
100 -
 101
101 -
 102
102 -
 103
103 -
 104
104 -
 105
105 -
 106
106 -
 107
107 -
 108
108 -
 109
109 -
 110
110 -
 111
111 -
 112
112 -
 113
113 -
 114
114 -
 115
115 -
 116
116 -
 117
117 -
 118
118 -
 119
119 -
 120
120 -
121
-
122
-
123
-
124
-
125
-
126
-
127
-
128
-
129
-
130
-
131
-
132
-
133
-
134
-
135
-
136
-
137
-
138
-
139
-
140
-
141
-
142
-
143
-
144
-
145
-
146
-
147
-
148
-
149
-
150
-
151
-
152
-
153
-
154
-
155
-
156
-
157
-
158
-
159
-
160
-
161
-
162
-
163
-
164
-
165
-
166
-
167
-
168
-
169
-
170
-
171
-
172
-
173
-
174
-
175
-
176
-
177
-
178
-
179
-
180
-
181
-
182
-
183
-
184
-
185
-
186
-
187
-
188
-
189
-
190
-
191
-
192
-
193
-
194
-
195
-
196
-
197
-
198
-
199
-
200
-
201
-
202
-
203
-
204
-
205
-
206
-
207
-
208
-
209
-
210
-
211
-
212
-
213
-
214
-
215
-
216
-
217
-
218
-
219
-
220
-
221
-
222
-
223
-
224
-
225
-
226
-
227
-
228
-
229
-
230
-
231
-
232
-
233
-
234
-
235
-
236
-
237
-
238
-
239
-
240
-
241
-
242
-
243
-
244
-
245
-
246
-
247
-
248
-
249
-
250
-
251
-
252
-
253
-
254
 |
 |

Short-Term Borrowings
See Note 11 “Short-Term Borrowings” to the consolidated financial statements for a summary of these
borrowings at December 31, 2012 and 2011. Short-term borrowings totaled $1.6 billion at December 31, 2012,
compared to $3.1 billion at December 31, 2011. The levels of these borrowings can fluctuate depending on the
Company’s funding needs and the sources utilized, as well as a result of customers’ activity.
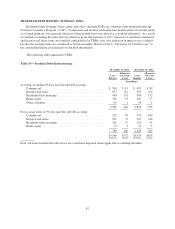
COMPANY FUNDING SOURCES
Short-term borrowings used as a source of funding for the Company totaled $21 million at December 31,
2012, compared to $1.0 billion at December 31, 2011. At December 31, 2012, federal funds purchased were the
only Company sources of short-term borrowings. At December 31, 2011, federal funds purchased, securities sold
under agreements to repurchase, and other short-term borrowings were outstanding. Other short-term borrowings
were related to Morgan Keegan and included borrowings under lines of credit that Morgan Keegan maintained
with unaffiliated banks. As of December 31, 2012, there were no other short-term borrowings related to Morgan
Keegan outstanding as a result of the sale of Morgan Keegan on April 2, 2012.
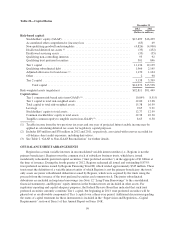
Table 26 “Selected Short-Term Borrowings Data” provides selected information for certain short-term
borrowings used for funding purposes for the years 2012, 2011, and 2010.
Table 26—Selected Short-Term Borrowings Data
2012 2011 2010
(Dollars in millions)
Federal funds purchased:
Balance at year end .................................................. $ 21 $ 18 $ 19
Average outstanding (based on average daily balances) ..................... 21 19 68
Maximum amount outstanding at any month-end .......................... 28 22 106
Weighted-average interest rate at year end ................................ 0.1% 0.1% 0.1%
Weighted-average interest rate on amounts outstanding during the year (based on
average daily balances) ............................................. 0.1% 0.1% 0.1%
Securities sold under agreements to repurchase:
Balance at year end .................................................. $ — $969 $ 763
Average outstanding (based on average daily balances) ..................... 633 419 456
Maximum amount outstanding at any month-end .......................... 1,940 969 1,151
Weighted-average interest rate at year end ................................ — % (0.2)% 0.3%
Weighted-average interest rate on amounts outstanding during the year (based on
average daily balances) ............................................. 0.1% (0.6)% 0.2%
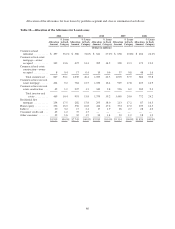
The negative weighted-average interest rates on securities sold under agreements to repurchase during 2011
were the result of, in part, Regions’ entering into reverse-repurchase agreements. There are times when financing
costs associated with these transactions are lower than typical repurchase agreement rates as a result of a supply
and demand imbalance in particular collateral. Since short-term repurchase agreement rates were close to zero
during the last half of 2011, the supply and demand imbalance related to securities that Regions owned led to
negative financing rates.
CUSTOMER-RELATED BORROWINGS
Short-term borrowings that are the result of customer activity related to investment opportunities or
brokerage interests totaled $1.6 billion at December 31, 2012, compared to $2.1 billion at December 31, 2011.
The decrease between periods was due to decreased brokerage customer liabilities and short-sale liabilities as a
result of the sale of Morgan Keegan on April 2, 2012.
94