Regions Bank 2012 Annual Report Download - page 130
Download and view the complete annual report
Please find page 130 of the 2012 Regions Bank annual report below. You can navigate through the pages in the report by either clicking on the pages listed below, or by using the keyword search tool below to find specific information within the annual report.-
 1
1 -
2
-
3
-
4
-
5
-
6
-
7
-
8
-
9
-
10
-
11
-
12
-
13
-
14
-
15
-
16
-
17
-
18
-
19
-
20
-
21
-
22
-
23
-
24
-
25
-
26
-
27
-
28
-
29
-
30
-
31
-
32
-
33
-
34
-
35
-
36
-
37
-
38
-
39
-
40
-
41
-
42
-
43
-
44
-
45
-
46
-
47
-
48
-
49
-
50
-
51
-
52
-
53
-
54
-
55
-
56
-
57
-
58
-
59
-
60
-
61
-
62
-
63
-
64
-
65
-
66
-
67
-
68
-
69
-
70
-
71
-
72
-
73
-
74
-
75
-
76
-
77
-
78
-
79
-
80
-
81
-
82
-
83
-
84
-
85
-
86
-
87
-
88
-
89
-
90
-
91
-
92
-
93
-
94
-
95
-
96
-
97
-
98
-
99
-
100
-
101
-
102
-
103
-
104
-
105
-
106
-
107
-
108
-
109
-
110
-
111
-
112
-
113
-
114
-
115
-
116
-
117
-
118
-
119
-
 120
120 -
 121
121 -
 122
122 -
 123
123 -
 124
124 -
 125
125 -
 126
126 -
 127
127 -
 128
128 -
 129
129 -
 130
130 -
 131
131 -
 132
132 -
 133
133 -
 134
134 -
 135
135 -
 136
136 -
 137
137 -
 138
138 -
 139
139 -
 140
140 -
141
-
142
-
143
-
144
-
145
-
146
-
147
-
148
-
149
-
150
-
151
-
152
-
153
-
154
-
155
-
156
-
157
-
158
-
159
-
160
-
161
-
162
-
163
-
164
-
165
-
166
-
167
-
168
-
169
-
170
-
171
-
172
-
173
-
174
-
175
-
176
-
177
-
178
-
179
-
180
-
181
-
182
-
183
-
184
-
185
-
186
-
187
-
188
-
189
-
190
-
191
-
192
-
193
-
194
-
195
-
196
-
197
-
198
-
199
-
200
-
201
-
202
-
203
-
204
-
205
-
206
-
207
-
208
-
209
-
210
-
211
-
212
-
213
-
214
-
215
-
216
-
217
-
218
-
219
-
220
-
221
-
222
-
223
-
224
-
225
-
226
-
227
-
228
-
229
-
230
-
231
-
232
-
233
-
234
-
235
-
236
-
237
-
238
-
239
-
240
-
241
-
242
-
243
-
244
-
245
-
246
-
247
-
248
-
249
-
250
-
251
-
252
-
253
-
254
 |
 |
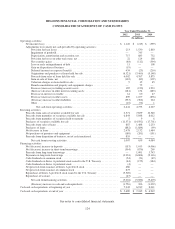
Non-interest expense from continuing operations was $3.9 billion in both 2011 and 2010 and included a
$253 million goodwill impairment charge in 2011 and a $75 million regulatory charge in 2010. See Table 6
“Non-Interest Expense from Continuing Operations” and the text preceding Table 2 “GAAP to Non-GAAP
Reconciliation”. Salaries and employee benefits remained relatively stable at $1.6 billion in 2011. At
December 31, 2011, Regions had 23,707 employees compared to 24,656 at December 31, 2010.
Net occupancy expense decreased 6 percent to $388 million in 2011. Furniture and equipment expense
decreased modestly by $2 million to $275 million in 2011. Both of these decreases were primarily driven by
branch consolidations.
Professional and legal fees are comprised of amounts related to legal, consulting and other professional fees.
These fees increased $5 million to $175 million in 2011, reflecting an increase in the level of legal expenses
including credit-related legal costs in 2011.
OREO expense decreased $47 million to $162 million in 2011 compared to $209 million in 2010, primarily driven
by the reduction in OREO balances along with lower valuation charges. Through Regions’ efforts to sell foreclosed
properties, OREO balances decreased $158 million to $296 million in 2011 compared to $454 million in 2010.
Net losses on loans held for sale decreased $31 million to $1 million in 2011 compared to $32 million in
2010, primarily due to firming prices.
Deposit administrative fees decreased $3 million to $217 million in 2011. Deposit administrative fees were
impacted by a new assessment rule in 2011, which revised the deposit insurance assessment system for large
institutions. The new rule changed the assessment base from deposits as the basis and utilizes a risk-based
approach which calculates the assessment using average consolidated assets minus average tangible equity.
Implementation of the new rule was effective beginning in the second quarter of 2011. The bank regulatory
agencies’ ratings, comprised of Regions Bank’s capital, asset quality, management, earnings, liquidity and
sensitivity to risk, along with certain financial ratios are used in determining deposit administrative fees.
During 2010, Regions prepaid approximately $2.0 billion of FHLB advances, realizing a $108 million pre-tax
loss on early extinguishment. These extinguishments were part of the Company’s asset/liability management process.
Other miscellaneous expenses include communications, postage, supplies, credit-related costs and business
development services. Other miscellaneous expenses decreased $18 million to $436 million in 2011, reflecting
the Company controlling discretionary costs.
The Company’s income tax benefit for 2011 was $28 million compared to a tax benefit of $376 million in
2010, resulting in an effective tax rate of (17.4) percent and 44.5 percent, respectively. The decrease in income
tax benefit was primarily a result of positive consolidated pre-tax earnings and the goodwill impairment.
At December 31, 2011, the allowance for loan losses totaled $2.7 billion or 3.54 percent of total loans, net
of unearned income compared to $3.2 billion or 3.84 percent at year-end 2010. Net charge-offs totaled $2.0
billion, or 2.44 percent of average loans in 2011 compared to $2.8 billion, or 3.22 percent of average loans in
2010. Net charge-offs were lower across most major categories when comparing 2011 to the prior year. The
provision for loan losses is used to maintain the allowance for loan losses at a level that in management’s
judgment is appropriate to cover losses inherent in the portfolio at the balance sheet date. During 2011 the
provision for loan losses was $1.5 billion. This compares to a provision for loan losses of $2.9 billion in 2010.
Net charge-offs exceeded the provision for loan losses during 2011 primarily due to the allowance associated
with the loans transferred to held for sale, as well as improving consumer credit metrics. Non-performing assets
decreased from $3.9 billion at December 31, 2010, to $3.0 billion at December 31, 2011, reflecting
management’s efforts to work through problem assets and reduce the riskiest exposures.
114