Regions Bank 2012 Annual Report Download - page 164
Download and view the complete annual report
Please find page 164 of the 2012 Regions Bank annual report below. You can navigate through the pages in the report by either clicking on the pages listed below, or by using the keyword search tool below to find specific information within the annual report.-
 1
1 -
2
-
3
-
4
-
5
-
6
-
7
-
8
-
9
-
10
-
11
-
12
-
13
-
14
-
15
-
16
-
17
-
18
-
19
-
20
-
21
-
22
-
23
-
24
-
25
-
26
-
27
-
28
-
29
-
30
-
31
-
32
-
33
-
34
-
35
-
36
-
37
-
38
-
39
-
40
-
41
-
42
-
43
-
44
-
45
-
46
-
47
-
48
-
49
-
50
-
51
-
52
-
53
-
54
-
55
-
56
-
57
-
58
-
59
-
60
-
61
-
62
-
63
-
64
-
65
-
66
-
67
-
68
-
69
-
70
-
71
-
72
-
73
-
74
-
75
-
76
-
77
-
78
-
79
-
80
-
81
-
82
-
83
-
84
-
85
-
86
-
87
-
88
-
89
-
90
-
91
-
92
-
93
-
94
-
95
-
96
-
97
-
98
-
99
-
100
-
101
-
102
-
103
-
104
-
105
-
106
-
107
-
108
-
109
-
110
-
111
-
112
-
113
-
114
-
115
-
116
-
117
-
118
-
119
-
120
-
121
-
122
-
123
-
124
-
125
-
126
-
127
-
128
-
129
-
130
-
131
-
132
-
133
-
134
-
135
-
136
-
137
-
138
-
139
-
140
-
141
-
142
-
143
-
144
-
145
-
146
-
147
-
148
-
149
-
150
-
151
-
152
-
153
-
 154
154 -
 155
155 -
 156
156 -
 157
157 -
 158
158 -
 159
159 -
 160
160 -
 161
161 -
 162
162 -
 163
163 -
 164
164 -
 165
165 -
 166
166 -
 167
167 -
 168
168 -
 169
169 -
 170
170 -
 171
171 -
 172
172 -
 173
173 -
 174
174 -
175
-
176
-
177
-
178
-
179
-
180
-
181
-
182
-
183
-
184
-
185
-
186
-
187
-
188
-
189
-
190
-
191
-
192
-
193
-
194
-
195
-
196
-
197
-
198
-
199
-
200
-
201
-
202
-
203
-
204
-
205
-
206
-
207
-
208
-
209
-
210
-
211
-
212
-
213
-
214
-
215
-
216
-
217
-
218
-
219
-
220
-
221
-
222
-
223
-
224
-
225
-
226
-
227
-
228
-
229
-
230
-
231
-
232
-
233
-
234
-
235
-
236
-
237
-
238
-
239
-
240
-
241
-
242
-
243
-
244
-
245
-
246
-
247
-
248
-
249
-
250
-
251
-
252
-
253
-
254
 |
 |

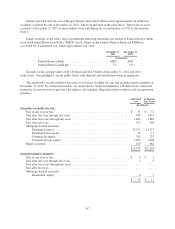
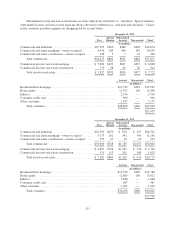
The following tables present gross unrealized losses and the related estimated fair values of securities
available for sale at December 31, 2012 and 2011. There were no gross unrealized losses on debt securities held
to maturity at both December 31, 2012 and 2011. These securities are segregated between investments that have
been in a continuous unrealized loss position for less than twelve months and twelve months or more.
December 31, 2012
Less Than
Twelve Months Twelve Months or More Total
Estimated Fair
Value
Gross
Unrealized
Losses
Estimated Fair
Value
Gross
Unrealized
Losses
Estimated Fair
Value
Gross
Unrealized
Losses
(In millions)
Federal agency securities ..... $ 350 $ (1) $— $— $ 350 $ (1)
Mortgage-backed securities:
Residential agency ...... 1,777 (16) 157 (2) 1,934 (18)
All other securities .......... 884 (9) — — 884 (9)
$3,011 $(26) $157 $ (2) $3,168 $(28)
December 31, 2011
Less Than
Twelve Months Twelve Months or More Total
Estimated Fair
Value
Gross
Unrealized
Losses
Estimated Fair
Value
Gross
Unrealized
Losses
Estimated Fair
Value
Gross
Unrealized
Losses
(In millions)
Mortgage-backed securities:
Residential agency ...... $1,778 $ (7) $— $— $1,778 $ (7)
All other securities .......... 291 (9) 5 (2) 296 (11)
$2,069 $(16) $ 5 $ (2) $2,074 $(18)
For the securities included in the tables above, management does not believe any individual unrealized loss,
which was comprised of 378 securities and 524 securities at December 31, 2012 and 2011, respectively,
represented an other-than-temporary impairment as of those dates. The Company does not intend to sell, and it is
not more likely than not that the Company will be required to sell, the securities before the recovery of their
amortized cost basis, which may be at maturity.
Credit-related impairment charges were immaterial for the years ended December 31, 2012, 2011, and 2010.
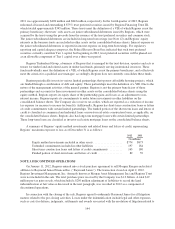
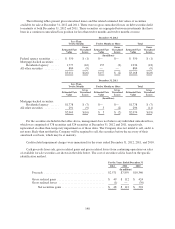
Cash proceeds from sale, gross realized gains and gross realized losses from continuing operations on sales
of available for sale securities are shown in the table below. The cost of securities sold is based on the specific
identification method.
For the Years Ended December 31
2012 2011 2010
(In millions)
Proceeds ......................................... $2,571 $7,859 $10,340
Gross realized gains ................................ $ 49 $ 112 $ 424
Gross realized losses ............................... (1) — (30)
Net securities gains ............................. $ 48 $ 112 $ 394
148