Regions Bank 2012 Annual Report Download - page 177
Download and view the complete annual report
Please find page 177 of the 2012 Regions Bank annual report below. You can navigate through the pages in the report by either clicking on the pages listed below, or by using the keyword search tool below to find specific information within the annual report.-
 1
1 -
2
-
3
-
4
-
5
-
6
-
7
-
8
-
9
-
10
-
11
-
12
-
13
-
14
-
15
-
16
-
17
-
18
-
19
-
20
-
21
-
22
-
23
-
24
-
25
-
26
-
27
-
28
-
29
-
30
-
31
-
32
-
33
-
34
-
35
-
36
-
37
-
38
-
39
-
40
-
41
-
42
-
43
-
44
-
45
-
46
-
47
-
48
-
49
-
50
-
51
-
52
-
53
-
54
-
55
-
56
-
57
-
58
-
59
-
60
-
61
-
62
-
63
-
64
-
65
-
66
-
67
-
68
-
69
-
70
-
71
-
72
-
73
-
74
-
75
-
76
-
77
-
78
-
79
-
80
-
81
-
82
-
83
-
84
-
85
-
86
-
87
-
88
-
89
-
90
-
91
-
92
-
93
-
94
-
95
-
96
-
97
-
98
-
99
-
100
-
101
-
102
-
103
-
104
-
105
-
106
-
107
-
108
-
109
-
110
-
111
-
112
-
113
-
114
-
115
-
116
-
117
-
118
-
119
-
120
-
121
-
122
-
123
-
124
-
125
-
126
-
127
-
128
-
129
-
130
-
131
-
132
-
133
-
134
-
135
-
136
-
137
-
138
-
139
-
140
-
141
-
142
-
143
-
144
-
145
-
146
-
147
-
148
-
149
-
150
-
151
-
152
-
153
-
154
-
155
-
156
-
157
-
158
-
159
-
160
-
161
-
162
-
163
-
164
-
165
-
166
-
 167
167 -
 168
168 -
 169
169 -
 170
170 -
 171
171 -
 172
172 -
 173
173 -
 174
174 -
 175
175 -
 176
176 -
 177
177 -
 178
178 -
 179
179 -
 180
180 -
 181
181 -
 182
182 -
 183
183 -
 184
184 -
 185
185 -
 186
186 -
 187
187 -
188
-
189
-
190
-
191
-
192
-
193
-
194
-
195
-
196
-
197
-
198
-
199
-
200
-
201
-
202
-
203
-
204
-
205
-
206
-
207
-
208
-
209
-
210
-
211
-
212
-
213
-
214
-
215
-
216
-
217
-
218
-
219
-
220
-
221
-
222
-
223
-
224
-
225
-
226
-
227
-
228
-
229
-
230
-
231
-
232
-
233
-
234
-
235
-
236
-
237
-
238
-
239
-
240
-
241
-
242
-
243
-
244
-
245
-
246
-
247
-
248
-
249
-
250
-
251
-
252
-
253
-
254
 |
 |

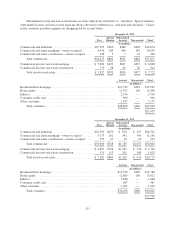
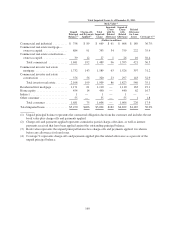
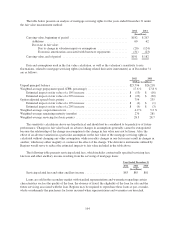
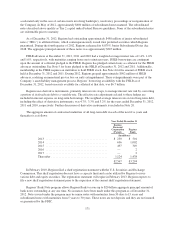
The following table presents the average balances of total impaired loans and interest income for the years
ended December 31, 2012 and 2011. Interest income recognized represents interest recognized on loans modified
in a TDR, and are therefore considered impaired, which are on accruing status.
Year Ended December 31
2012 2011
Average
Balance
Interest
Income
Recognized
Average
Balance
Interest
Income
Recognized
(In millions)
Commercial and industrial .................................. $ 707 $ 16 $ 563 $ 7
Commercial real estate mortgage—owner-occupied .............. 737 11 761 5
Commercial real estate construction—owner-occupied ............ 23 — 30 —
Total commercial ..................................... 1,467 27 1,354 12
Commercial investor real estate mortgage ...................... 1,510 40 1,457 22
Commercial investor real estate construction .................... 210 7 449 4
Total investor real estate ................................ 1,720 47 1,906 26
Residential first mortgage ................................... 1,157 39 1,086 41
Home equity ............................................. 439 22 410 21
Indirect ................................................. 2 — 2 —
Other consumer ........................................... 47 3 61 4
Total consumer ....................................... 1,645 64 1,559 66
Total impaired loans ....................................... $4,832 $138 $4,819 $104
No material amount of interest income was recognized on impaired loans for the year ended December 31,
2010.
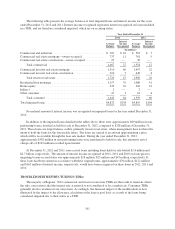
In addition to the impaired loans detailed in the tables above, there were approximately $89 million in non-
performing loans classified as held for sale at December 31, 2012, compared to $328 million at December 31,
2011. These loans are larger balance credits, primarily investor real estate, where management does not have the
intent to hold the loans for the foreseeable future. The loans are carried at an amount approximating a price
which will be recoverable through the loan sale market. During the year ended December 31, 2012,
approximately $302 million in non-performing loans were transferred to held for sale; this amount is net of
charge-offs of $163 million recorded upon transfer.
At December 31, 2012 and 2011, non-accrual loans including loans held for sale totaled $1.8 billion and
$2.7 billion, respectively. The amount of interest income recognized in 2012, 2011 and 2010 on loans prior to
migrating to non-accrual status was approximately $18 million, $23 million and $47 million, respectively. If
these loans had been current in accordance with their original terms, approximately $76 million, $122 million
and $165 million of interest income, respectively, would have been recognized on these loans in 2012, 2011 and
2010.
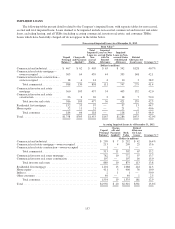
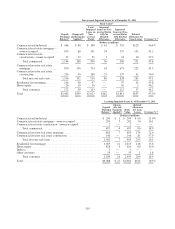
TROUBLED DEBT RESTRUCTURINGS (TDRs)
The majority of Regions’ 2012 commercial and investor real estate TDRs are the result of renewals where
the only concession is that the interest rate at renewal is not considered to be a market rate. Consumer TDRs
generally involve an interest rate concession. Accordingly, the financial impact of the modifications is best
illustrated by the impact to the allowance calculation at the loan or pool level as a result of the loans being
considered impaired due to their status as a TDR.
161