Regions Bank 2012 Annual Report Download - page 204
Download and view the complete annual report
Please find page 204 of the 2012 Regions Bank annual report below. You can navigate through the pages in the report by either clicking on the pages listed below, or by using the keyword search tool below to find specific information within the annual report.-
 1
1 -
2
-
3
-
4
-
5
-
6
-
7
-
8
-
9
-
10
-
11
-
12
-
13
-
14
-
15
-
16
-
17
-
18
-
19
-
20
-
21
-
22
-
23
-
24
-
25
-
26
-
27
-
28
-
29
-
30
-
31
-
32
-
33
-
34
-
35
-
36
-
37
-
38
-
39
-
40
-
41
-
42
-
43
-
44
-
45
-
46
-
47
-
48
-
49
-
50
-
51
-
52
-
53
-
54
-
55
-
56
-
57
-
58
-
59
-
60
-
61
-
62
-
63
-
64
-
65
-
66
-
67
-
68
-
69
-
70
-
71
-
72
-
73
-
74
-
75
-
76
-
77
-
78
-
79
-
80
-
81
-
82
-
83
-
84
-
85
-
86
-
87
-
88
-
89
-
90
-
91
-
92
-
93
-
94
-
95
-
96
-
97
-
98
-
99
-
100
-
101
-
102
-
103
-
104
-
105
-
106
-
107
-
108
-
109
-
110
-
111
-
112
-
113
-
114
-
115
-
116
-
117
-
118
-
119
-
120
-
121
-
122
-
123
-
124
-
125
-
126
-
127
-
128
-
129
-
130
-
131
-
132
-
133
-
134
-
135
-
136
-
137
-
138
-
139
-
140
-
141
-
142
-
143
-
144
-
145
-
146
-
147
-
148
-
149
-
150
-
151
-
152
-
153
-
154
-
155
-
156
-
157
-
158
-
159
-
160
-
161
-
162
-
163
-
164
-
165
-
166
-
167
-
168
-
169
-
170
-
171
-
172
-
173
-
174
-
175
-
176
-
177
-
178
-
179
-
180
-
181
-
182
-
183
-
184
-
185
-
186
-
187
-
188
-
189
-
190
-
191
-
192
-
193
-
 194
194 -
 195
195 -
 196
196 -
 197
197 -
 198
198 -
 199
199 -
 200
200 -
 201
201 -
 202
202 -
 203
203 -
 204
204 -
 205
205 -
 206
206 -
 207
207 -
 208
208 -
 209
209 -
 210
210 -
 211
211 -
 212
212 -
 213
213 -
 214
214 -
215
-
216
-
217
-
218
-
219
-
220
-
221
-
222
-
223
-
224
-
225
-
226
-
227
-
228
-
229
-
230
-
231
-
232
-
233
-
234
-
235
-
236
-
237
-
238
-
239
-
240
-
241
-
242
-
243
-
244
-
245
-
246
-
247
-
248
-
249
-
250
-
251
-
252
-
253
-
254
 |
 |

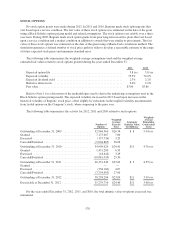
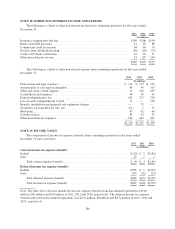
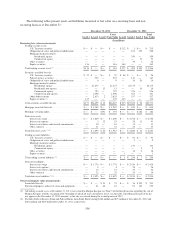
Significant components of the Company’s net deferred tax asset at December 31 are listed below:
2012 2011
(In millions)
Deferred tax assets:
Allowance for loan losses ................................................... $ 757 $1,069
Accrued expenses ......................................................... 219 110
Net operating loss carryfowards, if applicable, net of federal tax effect ............... 187 195
Federal tax credit carryforwards .............................................. 177 260
Employee benefits and deferred compensation ................................... 64 115
Unrealized gains and losses included in stockholders’ equity ....................... — 46
Other ................................................................... 115 154
Total deferred tax assets ................................................ 1,519 1,949
Less: valuation allowance ................................................... (70) (32)
Total deferred tax assets less valuation allowance ............................ 1,449 1,917
Deferred tax liabilities:
Lease financing ........................................................... 344 315
Goodwill and intangibles ................................................... 191 200
Mortgage servicing rights ................................................... 62 54
Unrealized gains and losses included in stockholders’ equity ....................... 37 —
Fixed assets .............................................................. 17 25
Other ................................................................... 35 37
Total deferred tax liabilities ............................................. 686 631
Net deferred tax asset .......................................................... $ 763 $1,286
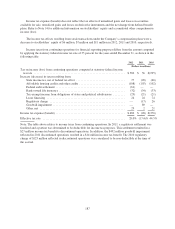
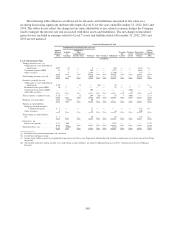
The following table provides details of the Company’s tax carryforwards at December 31, 2012, including
the expiration dates, any related valuation allowance and the amount of taxable earnings necessary to fully
realize each net deferred tax asset balance:
Expiration Dates
Deferred Tax
Asset Balance
Valuation
Allowance
Net Deferred Tax
Asset Balance
Pre-Tax
Earnings
Necessary to
Realize (1)
(In millions)
General business credits-federal ........ 2030-2032 $167 $— $167 $ N/A
Alternate minimum tax credits-federal . . . None(2) 10 — 10 N/A
Net operating losses-states ............. 2013-2017 48 (24) 24 581
Net operating losses-states ............. 2018-2024 69 (27) 42 1,055
Net operating losses-states ............. 2025-2032 70 (14) 56 1,513
Other credits-states .................. 2013-2017 7 (5) 2 N/A
(1) N/A indicates that credits are not measured on a pre-tax basis.
(2) Alternative minimum tax credits can be carried forward indefinitely.
Of the $763 million net deferred tax asset, $301 million relates to net operating losses and tax carryforwards
of which $68 million expires before 2025 (as detailed in the table above). The remaining $462 million of net
deferred tax assets do not have a set expiration date at December 31, 2012.
The Company’s determination of the realization of the net deferred tax asset is based on its assessment of all
available positive and negative evidence. At December 31, 2012, the Company is no longer in a three-year
cumulative loss position and therefore, does not have this negative evidence to consider in assessing the
188