Regions Bank 2012 Annual Report Download - page 140
Download and view the complete annual report
Please find page 140 of the 2012 Regions Bank annual report below. You can navigate through the pages in the report by either clicking on the pages listed below, or by using the keyword search tool below to find specific information within the annual report.-
 1
1 -
2
-
3
-
4
-
5
-
6
-
7
-
8
-
9
-
10
-
11
-
12
-
13
-
14
-
15
-
16
-
17
-
18
-
19
-
20
-
21
-
22
-
23
-
24
-
25
-
26
-
27
-
28
-
29
-
30
-
31
-
32
-
33
-
34
-
35
-
36
-
37
-
38
-
39
-
40
-
41
-
42
-
43
-
44
-
45
-
46
-
47
-
48
-
49
-
50
-
51
-
52
-
53
-
54
-
55
-
56
-
57
-
58
-
59
-
60
-
61
-
62
-
63
-
64
-
65
-
66
-
67
-
68
-
69
-
70
-
71
-
72
-
73
-
74
-
75
-
76
-
77
-
78
-
79
-
80
-
81
-
82
-
83
-
84
-
85
-
86
-
87
-
88
-
89
-
90
-
91
-
92
-
93
-
94
-
95
-
96
-
97
-
98
-
99
-
100
-
101
-
102
-
103
-
104
-
105
-
106
-
107
-
108
-
109
-
110
-
111
-
112
-
113
-
114
-
115
-
116
-
117
-
118
-
119
-
120
-
121
-
122
-
123
-
124
-
125
-
126
-
127
-
128
-
129
-
 130
130 -
 131
131 -
 132
132 -
 133
133 -
 134
134 -
 135
135 -
 136
136 -
 137
137 -
 138
138 -
 139
139 -
 140
140 -
 141
141 -
 142
142 -
 143
143 -
 144
144 -
 145
145 -
 146
146 -
 147
147 -
 148
148 -
 149
149 -
 150
150 -
151
-
152
-
153
-
154
-
155
-
156
-
157
-
158
-
159
-
160
-
161
-
162
-
163
-
164
-
165
-
166
-
167
-
168
-
169
-
170
-
171
-
172
-
173
-
174
-
175
-
176
-
177
-
178
-
179
-
180
-
181
-
182
-
183
-
184
-
185
-
186
-
187
-
188
-
189
-
190
-
191
-
192
-
193
-
194
-
195
-
196
-
197
-
198
-
199
-
200
-
201
-
202
-
203
-
204
-
205
-
206
-
207
-
208
-
209
-
210
-
211
-
212
-
213
-
214
-
215
-
216
-
217
-
218
-
219
-
220
-
221
-
222
-
223
-
224
-
225
-
226
-
227
-
228
-
229
-
230
-
231
-
232
-
233
-
234
-
235
-
236
-
237
-
238
-
239
-
240
-
241
-
242
-
243
-
244
-
245
-
246
-
247
-
248
-
249
-
250
-
251
-
252
-
253
-
254
 |
 |

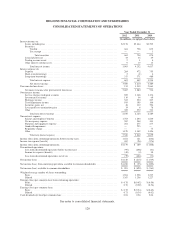
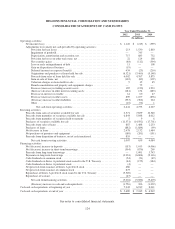
REGIONS FINANCIAL CORPORATION AND SUBSIDIARIES
CONSOLIDATED STATEMENTS OF CASH FLOWS
Year Ended December 31
2012 2011 2010
(In millions)
Operating activities:
Net income (loss) ...................................................... $ 1,120 $ (215) $ (539)
Adjustments to reconcile net cash provided by operating activities:
Provision for loan losses ............................................. 213 1,530 2,863
Impairment of goodwill .............................................. — 745 —
Depreciation, amortization and accretion, net ............................. 717 683 732
Provision for losses on other real estate, net .............................. 22 124 168
Net securities gains ................................................. (48) (112) (394)
Loss on early extinguishment of debt ................................... 11 — 108
Gain on disposition of business ........................................ (19) — —
Deferred income tax expense (benefit) .................................. 434 (23) (210)
Originations and purchases of loans held for sale .......................... (6,321) (3,460) (5,148)
Proceeds from sales of loans held for sale ............................... 6,002 4,767 5,875
Gain on sale of loans, net ............................................ (165) (89) (107)
Valuation charges on loans held for sale ................................. 9 15 45
Branch consolidation and property and equipment charges .................. — 75 —
Decrease (increase) in trading account assets ............................. 187 (150) 1,923
(Increase) decrease in other interest-earning assets ........................ (181) 134 (485)
Decrease in interest receivable ........................................ 14 60 47
Decrease (increase) in other assets ..................................... 809 1,107 (876)
(Decrease) increase in other liabilities .................................. (353) (366) 224
Other ............................................................ (10) (72) 1
Net cash from operating activities .................................. 2,441 4,753 4,227
Investing activities:
Proceeds from sales of securities available for sale ............................ 2,571 7,859 10,340
Proceeds from maturities of securities available for sale ........................ 6,844 5,848 8,012
Proceeds from maturities of securities held to maturity .........................596
Purchases of securities available for sale .................................... (11,571) (14,592) (17,701)
Proceeds from sales of loans .............................................. 887 1,488 2,233
Purchases of loans ...................................................... (882) (1,884) (99)
Net decrease in loans .................................................... 2,478 2,132 1,484
Net purchases of premises and equipment ................................... (180) (201) (191)
Proceeds from disposition of business, net of cash transferred .................... 855 — —
Net cash from investing activities ...................................... 1,007 659 4,084
Financing activities:
Net (decrease) increase in deposits ......................................... (153) 1,013 (4,066)
Net (decrease) increase in short-term borrowings .............................. (564) (870) 269
Proceeds from long-term borrowings ....................................... — 1,001 3,743
Payments on long-term borrowings ........................................ (2,201) (6,004) (9,116)
Cash dividends on common stock .......................................... (54) (51) (49)
Cash dividends on Series A preferred stock issued to the U.S. Treasury ............ (44) (175) (184)
Cash dividends on Series A preferred stock .................................. (4) — —
Net proceeds from issuance of Series A preferred stock ........................ 486 — —
Net proceeds from issuance of common stock ................................ 875 — —
Repurchase of Series A preferred stock issued to the U.S. Treasury ............... (3,500) — —
Repurchase of warrant ................................................... (45) — —
Net cash from financing activities ...................................... (5,204) (5,086) (9,403)
(Decrease) increase in cash and cash equivalents .......................... (1,756) 326 (1,092)
Cash and cash equivalents at beginning of year ................................... 7,245 6,919 8,011
Cash and cash equivalents at end of year ........................................ $ 5,489 $ 7,245 $ 6,919
See notes to consolidated financial statements.
124