Regions Bank 2012 Annual Report Download - page 192
Download and view the complete annual report
Please find page 192 of the 2012 Regions Bank annual report below. You can navigate through the pages in the report by either clicking on the pages listed below, or by using the keyword search tool below to find specific information within the annual report.-
 1
1 -
2
-
3
-
4
-
5
-
6
-
7
-
8
-
9
-
10
-
11
-
12
-
13
-
14
-
15
-
16
-
17
-
18
-
19
-
20
-
21
-
22
-
23
-
24
-
25
-
26
-
27
-
28
-
29
-
30
-
31
-
32
-
33
-
34
-
35
-
36
-
37
-
38
-
39
-
40
-
41
-
42
-
43
-
44
-
45
-
46
-
47
-
48
-
49
-
50
-
51
-
52
-
53
-
54
-
55
-
56
-
57
-
58
-
59
-
60
-
61
-
62
-
63
-
64
-
65
-
66
-
67
-
68
-
69
-
70
-
71
-
72
-
73
-
74
-
75
-
76
-
77
-
78
-
79
-
80
-
81
-
82
-
83
-
84
-
85
-
86
-
87
-
88
-
89
-
90
-
91
-
92
-
93
-
94
-
95
-
96
-
97
-
98
-
99
-
100
-
101
-
102
-
103
-
104
-
105
-
106
-
107
-
108
-
109
-
110
-
111
-
112
-
113
-
114
-
115
-
116
-
117
-
118
-
119
-
120
-
121
-
122
-
123
-
124
-
125
-
126
-
127
-
128
-
129
-
130
-
131
-
132
-
133
-
134
-
135
-
136
-
137
-
138
-
139
-
140
-
141
-
142
-
143
-
144
-
145
-
146
-
147
-
148
-
149
-
150
-
151
-
152
-
153
-
154
-
155
-
156
-
157
-
158
-
159
-
160
-
161
-
162
-
163
-
164
-
165
-
166
-
167
-
168
-
169
-
170
-
171
-
172
-
173
-
174
-
175
-
176
-
177
-
178
-
179
-
180
-
181
-
 182
182 -
 183
183 -
 184
184 -
 185
185 -
 186
186 -
 187
187 -
 188
188 -
 189
189 -
 190
190 -
 191
191 -
 192
192 -
 193
193 -
 194
194 -
 195
195 -
 196
196 -
 197
197 -
 198
198 -
 199
199 -
 200
200 -
 201
201 -
 202
202 -
203
-
204
-
205
-
206
-
207
-
208
-
209
-
210
-
211
-
212
-
213
-
214
-
215
-
216
-
217
-
218
-
219
-
220
-
221
-
222
-
223
-
224
-
225
-
226
-
227
-
228
-
229
-
230
-
231
-
232
-
233
-
234
-
235
-
236
-
237
-
238
-
239
-
240
-
241
-
242
-
243
-
244
-
245
-
246
-
247
-
248
-
249
-
250
-
251
-
252
-
253
-
254
 |
 |

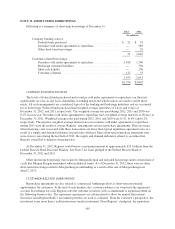
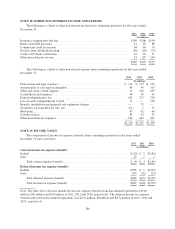
NOTE 15. EARNINGS (LOSS) PER COMMON SHARE
The following table sets forth the computation of basic earnings (loss) per common share and diluted
earnings (loss) per common share for the years ended December 31:
2012 2011 2010
(In millions, except per share amounts)
Numerator:
Income (loss) from continuing operations ............................... $1,179 $ 189 $ (468)
Preferred stock dividends and accretion ................................ (129) (214) (224)
Income (loss) from continuing operations available to common shareholders . . . 1,050 (25) (692)
Loss from discontinued operations, net of tax ............................ (59) (404) (71)
Net income (loss) available to common shareholders ...................... $ 991 $ (429) $ (763)
Denominator:
Weighted-average common shares outstanding—basic ..................... 1,381 1,258 1,227
Potential common shares ............................................ 6 — —
Weighted-average common shares outstanding—diluted ................... 1,387 1,258 1,227
Earnings (loss) per common share from continuing operations(1):
Basic ............................................................ $ 0.76 $ (0.02) $ (0.56)
Diluted .......................................................... 0.76 (0.02) (0.56)
Loss per common share from discontinued operations(1):
Basic ............................................................ (0.04) (0.32) (0.06)
Diluted .......................................................... (0.04) (0.32) (0.06)
Earnings (loss) per common share(1):
Basic ............................................................ 0.72 (0.34) (0.62)
Diluted .......................................................... 0.71 (0.34) (0.62)
(1) Certain per share amounts may not appear to reconcile due to rounding.
In 2012, diluted earnings per common share from continuing operations is calculated using a denominator of
1,387 million shares, which includes 6 million potential common shares. Basic and diluted weighted-average
common shares outstanding for earnings per common share from continuing operations and in total are the same
for 2011 and 2010 due to the Company experiencing net losses. For earnings per common share from
discontinued operations, basic and diluted weighted-average common shares outstanding are the same for all
periods presented due to the Company experiencing net losses.
The effect from the assumed exercise of 36 million stock options for the year ended December 31, 2012,
was not included in the above computations of diluted earnings per common share because such amounts would
have had an antidilutive effect on earnings per common share.
As discussed in Note 14, approximately 63 million common shares were issued in June of 2010 in
connection with the conversion of the remaining Series B mandatorily convertible preferred shares, which were
originally issued in May 2009. Under applicable accounting literature, such shares should be included in the
denominator in arriving at diluted earnings per share as if they were issued at the beginning of the reporting
period or as of the date issued, if later. Prior to conversion, these shares were not included in the computation
above as such amounts would have had an antidilutive effect on earnings (loss) per common share.
176