Regions Bank 2012 Annual Report Download - page 68
Download and view the complete annual report
Please find page 68 of the 2012 Regions Bank annual report below. You can navigate through the pages in the report by either clicking on the pages listed below, or by using the keyword search tool below to find specific information within the annual report.-
 1
1 -
2
-
3
-
4
-
5
-
6
-
7
-
8
-
9
-
10
-
11
-
12
-
13
-
14
-
15
-
16
-
17
-
18
-
19
-
20
-
21
-
22
-
23
-
24
-
25
-
26
-
27
-
28
-
29
-
30
-
31
-
32
-
33
-
34
-
35
-
36
-
37
-
38
-
39
-
40
-
41
-
42
-
43
-
44
-
45
-
46
-
47
-
48
-
49
-
50
-
51
-
52
-
53
-
54
-
55
-
56
-
57
-
 58
58 -
 59
59 -
 60
60 -
 61
61 -
 62
62 -
 63
63 -
 64
64 -
 65
65 -
 66
66 -
 67
67 -
 68
68 -
 69
69 -
 70
70 -
 71
71 -
 72
72 -
 73
73 -
 74
74 -
 75
75 -
 76
76 -
 77
77 -
 78
78 -
79
-
80
-
81
-
82
-
83
-
84
-
85
-
86
-
87
-
88
-
89
-
90
-
91
-
92
-
93
-
94
-
95
-
96
-
97
-
98
-
99
-
100
-
101
-
102
-
103
-
104
-
105
-
106
-
107
-
108
-
109
-
110
-
111
-
112
-
113
-
114
-
115
-
116
-
117
-
118
-
119
-
120
-
121
-
122
-
123
-
124
-
125
-
126
-
127
-
128
-
129
-
130
-
131
-
132
-
133
-
134
-
135
-
136
-
137
-
138
-
139
-
140
-
141
-
142
-
143
-
144
-
145
-
146
-
147
-
148
-
149
-
150
-
151
-
152
-
153
-
154
-
155
-
156
-
157
-
158
-
159
-
160
-
161
-
162
-
163
-
164
-
165
-
166
-
167
-
168
-
169
-
170
-
171
-
172
-
173
-
174
-
175
-
176
-
177
-
178
-
179
-
180
-
181
-
182
-
183
-
184
-
185
-
186
-
187
-
188
-
189
-
190
-
191
-
192
-
193
-
194
-
195
-
196
-
197
-
198
-
199
-
200
-
201
-
202
-
203
-
204
-
205
-
206
-
207
-
208
-
209
-
210
-
211
-
212
-
213
-
214
-
215
-
216
-
217
-
218
-
219
-
220
-
221
-
222
-
223
-
224
-
225
-
226
-
227
-
228
-
229
-
230
-
231
-
232
-
233
-
234
-
235
-
236
-
237
-
238
-
239
-
240
-
241
-
242
-
243
-
244
-
245
-
246
-
247
-
248
-
249
-
250
-
251
-
252
-
253
-
254
 |
 |
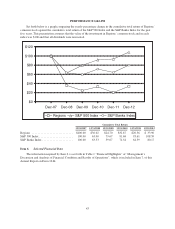
decreases were partially offset by growth in the commercial and industrial category and record growth in indirect
loans. Total deposits decreased $153 million in 2012 to $95.5 billion at December 31, 2012, and low-cost
customer deposits increased $5.8 billion, or 7.6 percent, in 2012.
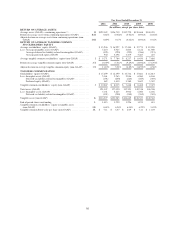
Regions’ Tier 1 common (non-GAAP) ratio was 10.84 percent at December 31, 2012. The corresponding
Basel III Tier 1 common ratio (non-GAAP), based on Regions’ current understanding of the guidelines, was
approximately 8.87 percent, which exceeds the Basel III minimum of 7.0 percent (see Table 2, “GAAP to Non-
GAAP Reconciliation” for a reconciliation of the non-GAAP measures to the corresponding GAAP or regulatory
measure).
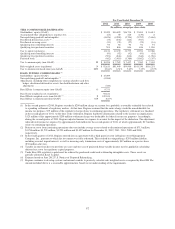
Table 2 “GAAP to Non-GAAP Reconciliation” presents computations of earnings (loss) and certain other
financial measures, which exclude certain significant items that are included in financial results presented in
accordance with generally accepted accounting principles (“GAAP”). These non-GAAP financial measures
include “fee income ratio”, “efficiency ratio”, “return on average assets from continuing operations”, “return on
average tangible common stockholders’ equity”, end of period and average “tangible common stockholders’
equity”, “Tier 1 common equity”, and “Basel III Tier 1 common equity” and related ratios. Regions believes that
the exclusion of these significant items in expressing earnings and certain other financial measures provides a
meaningful base for period-to-period comparisons, which management believes will assist investors in analyzing
the operating results of the Company and predicting future performance. These non-GAAP financial measures
are also used by management to assess the performance of Regions’ business because management does not
consider these charges to be as relevant to ongoing operating results. Management and the Board of Directors
utilize these non-GAAP financial measures as follows:
• Preparation of Regions’ operating budgets
• Monthly financial performance reporting
• Monthly close-out reporting of consolidated results (management only)
• Presentations to investors of Company performance
The efficiency ratio (non-GAAP), which is a measure of productivity, is generally calculated as non-interest
expense divided by total revenue on a taxable equivalent basis. The fee income ratio (non-GAAP) is generally
calculated as non-interest income divided by total revenue. Management uses these ratios to monitor
performance and believes these measures provide meaningful information to investors. Non-interest expense
(GAAP) is presented excluding adjustments to arrive at adjusted non-interest expense (non-GAAP), which is the
numerator for the efficiency ratio. Non-interest income (GAAP) is presented excluding adjustments to arrive at
adjusted non-interest income (non-GAAP), which is the numerator for the fee income ratio. Net interest income
on a taxable equivalent basis and non-interest income (GAAP) are added together to arrive at total revenue
(GAAP). Adjustments are made to arrive at adjusted total revenue (non-GAAP), which is the denominator for the
fee income and efficiency ratios. Regions believes that the non-GAAP measures reflecting these adjustments
provide a meaningful base for period-to-period comparisons, which management believes will assist investors in
analyzing the operating results of the Company and predicting future performance. These non-GAAP financial
measures are also used by management to assess the performance of Regions’ business. It is possible that the
activities related to the adjustments may recur; however, management does not consider the activities related to
the adjustments to be indications of ongoing operations. Regions believes that presentation of these non-GAAP
financial measures will permit investors to assess the performance of the Company on the same basis as that
applied by management.
Tangible common stockholders’ equity ratios have become a focus of some investors in analyzing the
capital position of the Company absent the effects of intangible assets and preferred stock. Traditionally, the
Federal Reserve and other banking regulatory bodies have assessed a bank’s capital adequacy based on Tier 1
capital, the calculation of which is codified in federal banking regulations. In connection with the Federal
Reserve’s Comprehensive Capital Analysis and Review process, these regulators are supplementing their
52