Regions Bank 2012 Annual Report Download - page 223
Download and view the complete annual report
Please find page 223 of the 2012 Regions Bank annual report below. You can navigate through the pages in the report by either clicking on the pages listed below, or by using the keyword search tool below to find specific information within the annual report.-
 1
1 -
2
-
3
-
4
-
5
-
6
-
7
-
8
-
9
-
10
-
11
-
12
-
13
-
14
-
15
-
16
-
17
-
18
-
19
-
20
-
21
-
22
-
23
-
24
-
25
-
26
-
27
-
28
-
29
-
30
-
31
-
32
-
33
-
34
-
35
-
36
-
37
-
38
-
39
-
40
-
41
-
42
-
43
-
44
-
45
-
46
-
47
-
48
-
49
-
50
-
51
-
52
-
53
-
54
-
55
-
56
-
57
-
58
-
59
-
60
-
61
-
62
-
63
-
64
-
65
-
66
-
67
-
68
-
69
-
70
-
71
-
72
-
73
-
74
-
75
-
76
-
77
-
78
-
79
-
80
-
81
-
82
-
83
-
84
-
85
-
86
-
87
-
88
-
89
-
90
-
91
-
92
-
93
-
94
-
95
-
96
-
97
-
98
-
99
-
100
-
101
-
102
-
103
-
104
-
105
-
106
-
107
-
108
-
109
-
110
-
111
-
112
-
113
-
114
-
115
-
116
-
117
-
118
-
119
-
120
-
121
-
122
-
123
-
124
-
125
-
126
-
127
-
128
-
129
-
130
-
131
-
132
-
133
-
134
-
135
-
136
-
137
-
138
-
139
-
140
-
141
-
142
-
143
-
144
-
145
-
146
-
147
-
148
-
149
-
150
-
151
-
152
-
153
-
154
-
155
-
156
-
157
-
158
-
159
-
160
-
161
-
162
-
163
-
164
-
165
-
166
-
167
-
168
-
169
-
170
-
171
-
172
-
173
-
174
-
175
-
176
-
177
-
178
-
179
-
180
-
181
-
182
-
183
-
184
-
185
-
186
-
187
-
188
-
189
-
190
-
191
-
192
-
193
-
194
-
195
-
196
-
197
-
198
-
199
-
200
-
201
-
202
-
203
-
204
-
205
-
206
-
207
-
208
-
209
-
210
-
211
-
212
-
 213
213 -
 214
214 -
 215
215 -
 216
216 -
 217
217 -
 218
218 -
 219
219 -
 220
220 -
 221
221 -
 222
222 -
 223
223 -
 224
224 -
 225
225 -
 226
226 -
 227
227 -
 228
228 -
 229
229 -
 230
230 -
 231
231 -
 232
232 -
 233
233 -
234
-
235
-
236
-
237
-
238
-
239
-
240
-
241
-
242
-
243
-
244
-
245
-
246
-
247
-
248
-
249
-
250
-
251
-
252
-
253
-
254
 |
 |

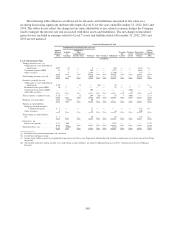
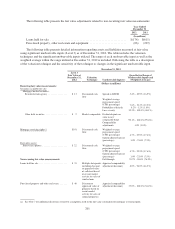
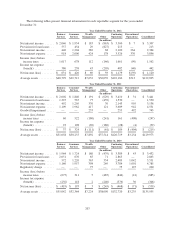
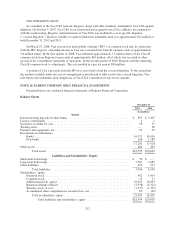
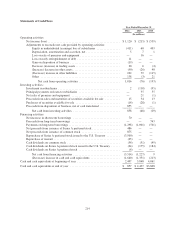
The following tables present financial information for each reportable segment for the years ended
December 31:
Year Ended December 31, 2012
Business
Services
Consumer
Services
Wealth
Management Other
Continuing
Operations
Discontinued
Operations Consolidated
(In millions)
Net interest income ...... $ 2,046 $ 1,934 $ 183 $ (863) $ 3,300 $ 7 $ 3,307
Provision for loan losses . . 557 454 29 (827) 213 — 213
Non-interest income ...... 446 1,204 382 68 2,100 264 2,364
Non-interest expense ..... 918 2,006 424 178 3,526 370 3,896
Income (loss) before
income taxes ......... 1,017 678 112 (146) 1,661 (99) 1,562
Income tax expense
(benefit) ............. 386 258 43 (205) 482 (40) 442
Net income (loss) ........ $ 631 $ 420 $ 69 $ 59 $ 1,179 $ (59) $ 1,120
Average assets .......... $48,799 $29,712 $7,632 $36,039 $122,182 $713 $122,895
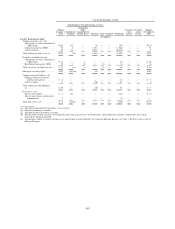
Year Ended December 31, 2011
Business
Services
Consumer
Services
Wealth
Management Other
Continuing
Operations
Discontinued
Operations Consolidated
(In millions)
Net interest income ...... $ 2,002 $ 1,846 $ 191 $ (629) $ 3,410 $ 31 $ 3,441
Provision for loan losses . . 1,325 567 77 (439) 1,530 — 1,530
Non-interest income ...... 492 1,205 376 70 2,143 995 3,138
Non-interest expense ..... 1,109 1,962 417 121 3,609 942 4,551
Goodwill impairment ..... — — 253 — 253 492 745
Income (loss) before
income taxes ......... 60 522 (180) (241) 161 (408) (247)
Income tax expense
(benefit) ............. 23 198 (69) (180) (28) (4) (32)
Net income (loss) ........ $ 37 $ 324 $ (111) $ (61) $ 189 $ (404) $ (215)
Average assets .......... $51,058 $30,255 $7,892 $37,514 $126,719 $3,254 $129,973
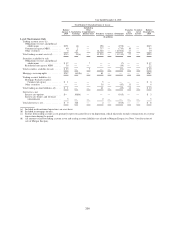
Year Ended December 31, 2010
Business
Services
Consumer
Services
Wealth
Management Other
Continuing
Operations
Discontinued
Operations Consolidated
(In millions)
Net interest income ...... $ 1,964 $ 1,724 $ 180 $ (479) $ 3,389 $ 43 $ 3,432
Provision for loan losses . . 2,051 676 65 71 2,863 — 2,863
Non-interest income ...... 572 1,220 363 334 2,489 1,042 3,531
Non-interest expense ..... 1,160 1,957 398 269 3,784 1,001 4,785
Regulatory charge ....... — — 75 — 75 125 200
Income (loss) before
income taxes ......... (675) 311 5 (485) (844) (41) (885)
Income tax expense
(benefit) ............. (256) 118 2 (240) (376) 30 (346)
Net income (loss) ........ $ (419) $ 193 $ 3 $ (245) $ (468) $ (71) $ (539)
Average assets .......... $55,042 $32,364 $7,224 $38,090 $132,720 $3,235 $135,955
207