Regions Bank 2012 Annual Report Download - page 160
Download and view the complete annual report
Please find page 160 of the 2012 Regions Bank annual report below. You can navigate through the pages in the report by either clicking on the pages listed below, or by using the keyword search tool below to find specific information within the annual report.-
 1
1 -
2
-
3
-
4
-
5
-
6
-
7
-
8
-
9
-
10
-
11
-
12
-
13
-
14
-
15
-
16
-
17
-
18
-
19
-
20
-
21
-
22
-
23
-
24
-
25
-
26
-
27
-
28
-
29
-
30
-
31
-
32
-
33
-
34
-
35
-
36
-
37
-
38
-
39
-
40
-
41
-
42
-
43
-
44
-
45
-
46
-
47
-
48
-
49
-
50
-
51
-
52
-
53
-
54
-
55
-
56
-
57
-
58
-
59
-
60
-
61
-
62
-
63
-
64
-
65
-
66
-
67
-
68
-
69
-
70
-
71
-
72
-
73
-
74
-
75
-
76
-
77
-
78
-
79
-
80
-
81
-
82
-
83
-
84
-
85
-
86
-
87
-
88
-
89
-
90
-
91
-
92
-
93
-
94
-
95
-
96
-
97
-
98
-
99
-
100
-
101
-
102
-
103
-
104
-
105
-
106
-
107
-
108
-
109
-
110
-
111
-
112
-
113
-
114
-
115
-
116
-
117
-
118
-
119
-
120
-
121
-
122
-
123
-
124
-
125
-
126
-
127
-
128
-
129
-
130
-
131
-
132
-
133
-
134
-
135
-
136
-
137
-
138
-
139
-
140
-
141
-
142
-
143
-
144
-
145
-
146
-
147
-
148
-
149
-
 150
150 -
 151
151 -
 152
152 -
 153
153 -
 154
154 -
 155
155 -
 156
156 -
 157
157 -
 158
158 -
 159
159 -
 160
160 -
 161
161 -
 162
162 -
 163
163 -
 164
164 -
 165
165 -
 166
166 -
 167
167 -
 168
168 -
 169
169 -
 170
170 -
171
-
172
-
173
-
174
-
175
-
176
-
177
-
178
-
179
-
180
-
181
-
182
-
183
-
184
-
185
-
186
-
187
-
188
-
189
-
190
-
191
-
192
-
193
-
194
-
195
-
196
-
197
-
198
-
199
-
200
-
201
-
202
-
203
-
204
-
205
-
206
-
207
-
208
-
209
-
210
-
211
-
212
-
213
-
214
-
215
-
216
-
217
-
218
-
219
-
220
-
221
-
222
-
223
-
224
-
225
-
226
-
227
-
228
-
229
-
230
-
231
-
232
-
233
-
234
-
235
-
236
-
237
-
238
-
239
-
240
-
241
-
242
-
243
-
244
-
245
-
246
-
247
-
248
-
249
-
250
-
251
-
252
-
253
-
254
 |
 |

2011 was approximately $498 million and $843 million, respectively. In the fourth quarter of 2012, Regions
redeemed all issued and outstanding 8.875% trust preferred securities issued by Regions Financing Trust III,
which totaled approximately $345 million. These trusts meet the definition of a VIE of which Regions is not the
primary beneficiary; the trusts’ only assets are junior subordinated debentures issued by Regions, which were
acquired by the trusts using the proceeds from the issuance of the trust preferred securities and common stock.
The junior subordinated debentures are included in long-term borrowings (see Note 12) and Regions’ equity
interests in the business trusts are included in other assets on the consolidated balance sheets. Interest expense on
the junior subordinated debentures is reported in interest expense on long-term borrowings. For regulatory
reporting and capital adequacy purposes, the Federal Reserve Board has indicated that such trust preferred
securities currently constitute Tier 1 capital, but beginning in 2013, trust preferred securities will be phased out
as an allowable component of Tier 1 capital over a three-year period.
Regions Timberland Group, a business of Regions that is managed by the trust division, operates and acts as
trustee for timber land and related assets in timber land funds, primarily serving institutional investors. These
funds individually meet the definition of a VIE, of which Regions is not the primary beneficiary, and collectively
meet the criteria for a qualified asset manager; accordingly, Regions does not currently consolidate these funds.
Regions periodically invests in various limited partnerships that sponsor affordable housing projects, which
are funded through a combination of debt and equity. These partnerships meet the definition of a VIE. Due to the
nature of the management activities of the general partner, Regions is not the primary beneficiary of these
partnerships and accounts for these investments in other assets on the consolidated balance sheets using the
equity method. Regions reports its equity share of the partnership gains and losses as an adjustment to non-
interest income. Regions reports its commitments to make future investments in other liabilities on the
consolidated balance sheets. The Company also receives tax credits, which are reported as a reduction of income
tax expense (or increase to income tax benefit). Additionally, Regions has short-term construction loans or letters
of credit commitments with certain limited partnerships. The funded portion of the short-term loans and letters of
credit is classified as commercial and industrial loans or investor real estate construction loans, as applicable, on
the consolidated balance sheets. Regions also has long-term mortgage loans with certain limited partnerships.
These long-term loans are classified as investor real estate mortgage loans on the consolidated balance sheets.
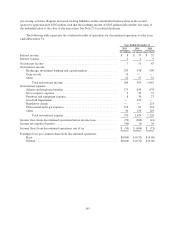
A summary of Regions’ equity method investments and related loans and letters of credit, representing
Regions’ maximum exposure to loss as of December 31 is as follows:
2012 2011
(In millions)
Equity method investments included in other assets .................... $774 $873
Unfunded commitments included in other liabilities ................... 197 184
Short-term construction loans and letters of credit commitments ......... 165 180
Funded portion of short-term loans and letters of credit ................. 82 59
NOTE 3. DISCONTINUED OPERATIONS
On January 11, 2012, Regions entered into a stock purchase agreement to sell Morgan Keegan and related
affiliates to Raymond James Financial Inc. (“Raymond James”). The transaction closed on April 2, 2012.
Regions Investment Management, Inc. (formerly known as Morgan Asset Management, Inc) and Regions Trust
were not included in the sale. The total purchase price received by the Company was $1.2 billion. A total $19
million pre-tax gain on sale, which included a $256 million adjustment of liabilities to record the legal
indemnification at fair value as discussed in the next paragraph, was recorded in 2012 as a component of
discontinued operations.
In connection with the closing of the sale, Regions agreed to indemnify Raymond James for all litigation
matters related to the pre-closing activities. Losses under the indemnification include legal and other expenses,
such as costs for defense, judgments, settlements and awards associated with the resolution of litigation related to
144