Regions Bank 2012 Annual Report Download - page 202
Download and view the complete annual report
Please find page 202 of the 2012 Regions Bank annual report below. You can navigate through the pages in the report by either clicking on the pages listed below, or by using the keyword search tool below to find specific information within the annual report.-
 1
1 -
2
-
3
-
4
-
5
-
6
-
7
-
8
-
9
-
10
-
11
-
12
-
13
-
14
-
15
-
16
-
17
-
18
-
19
-
20
-
21
-
22
-
23
-
24
-
25
-
26
-
27
-
28
-
29
-
30
-
31
-
32
-
33
-
34
-
35
-
36
-
37
-
38
-
39
-
40
-
41
-
42
-
43
-
44
-
45
-
46
-
47
-
48
-
49
-
50
-
51
-
52
-
53
-
54
-
55
-
56
-
57
-
58
-
59
-
60
-
61
-
62
-
63
-
64
-
65
-
66
-
67
-
68
-
69
-
70
-
71
-
72
-
73
-
74
-
75
-
76
-
77
-
78
-
79
-
80
-
81
-
82
-
83
-
84
-
85
-
86
-
87
-
88
-
89
-
90
-
91
-
92
-
93
-
94
-
95
-
96
-
97
-
98
-
99
-
100
-
101
-
102
-
103
-
104
-
105
-
106
-
107
-
108
-
109
-
110
-
111
-
112
-
113
-
114
-
115
-
116
-
117
-
118
-
119
-
120
-
121
-
122
-
123
-
124
-
125
-
126
-
127
-
128
-
129
-
130
-
131
-
132
-
133
-
134
-
135
-
136
-
137
-
138
-
139
-
140
-
141
-
142
-
143
-
144
-
145
-
146
-
147
-
148
-
149
-
150
-
151
-
152
-
153
-
154
-
155
-
156
-
157
-
158
-
159
-
160
-
161
-
162
-
163
-
164
-
165
-
166
-
167
-
168
-
169
-
170
-
171
-
172
-
173
-
174
-
175
-
176
-
177
-
178
-
179
-
180
-
181
-
182
-
183
-
184
-
185
-
186
-
187
-
188
-
189
-
190
-
191
-
 192
192 -
 193
193 -
 194
194 -
 195
195 -
 196
196 -
 197
197 -
 198
198 -
 199
199 -
 200
200 -
 201
201 -
 202
202 -
 203
203 -
 204
204 -
 205
205 -
 206
206 -
 207
207 -
 208
208 -
 209
209 -
 210
210 -
 211
211 -
 212
212 -
213
-
214
-
215
-
216
-
217
-
218
-
219
-
220
-
221
-
222
-
223
-
224
-
225
-
226
-
227
-
228
-
229
-
230
-
231
-
232
-
233
-
234
-
235
-
236
-
237
-
238
-
239
-
240
-
241
-
242
-
243
-
244
-
245
-
246
-
247
-
248
-
249
-
250
-
251
-
252
-
253
-
254
 |
 |

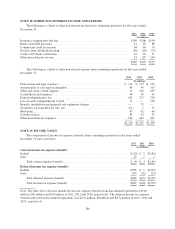
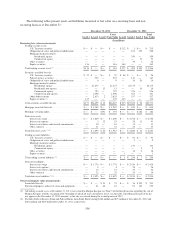
NOTE 18. OTHER NON-INTEREST INCOME AND EXPENSE
The following is a detail of other non-interest income from continuing operations for the years ended
December 31:
2012 2011 2010
(In millions)
Insurance commissions and fees ............................................... $109 $106 $104
Bank-owned life insurance ................................................... 81 83 88
Commercial credit fee income ................................................ 68 80 76
Net loss from affordable housing .............................................. (49) (69) (72)
Credit card / bank card income ................................................ 85 65 31
Other miscellaneous income .................................................. 91 107 104
$385 $372 $331
The following is a detail of other non-interest expense from continuing operations for the years ended
December 31:
2012 2011 2010
(In millions)
Professional and legal expenses ........................................... $ 114 $ 175 $ 170
Amortization of core deposit intangible ..................................... 83 95 107
Other real estate owned expense .......................................... 52 162 209
Credit/checkcard expenses ............................................... 64 50 41
Deposit administrative fee ............................................... 162 217 220
Loss on early extinguishment of debt ...................................... 11 — 108
Branch consolidation and property and equipment charges ..................... — 75 —
(Gain)/loss on loans held for sale, net ...................................... (61) 1 32
Marketing ............................................................ 87 62 66
Outside services ....................................................... 82 62 52
Other miscellaneous expenses ............................................ 526 443 451
$1,120 $1,342 $1,456
NOTE 19. INCOME TAXES
The components of income tax expense (benefit) from continuing operations for the years ended
December 31 were as follows:
2012 2011 2010
(In millions)
Current income tax expense (benefit):
Federal .................................................................. $(20) $ 2 $(183)
State .................................................................... 16 1 2
Total current expense (benefit) ............................................ $ (4) $ 3 $(181)
Deferred income tax expense (benefit):
Federal .................................................................. $383 $ 1 $(123)
State .................................................................... 103 (32) (72)
Total deferred expense (benefit) ........................................... $486 $(31) $(195)
Total income tax expense (benefit) ........................................ $482 $(28) $(376)
Note: The table above does not include income tax expense (benefit) from discontinued operations of $(40)
million, $(4) million and $30 million in 2012, 2011 and 2010, respectively. The deferred income tax expense
(benefit) reflected in discontinued operations was $(52) million, $8 million and $(15) million in 2012, 2011 and
2010, respectively.
186