Regions Bank 2012 Annual Report Download - page 121
Download and view the complete annual report
Please find page 121 of the 2012 Regions Bank annual report below. You can navigate through the pages in the report by either clicking on the pages listed below, or by using the keyword search tool below to find specific information within the annual report.-
 1
1 -
2
-
3
-
4
-
5
-
6
-
7
-
8
-
9
-
10
-
11
-
12
-
13
-
14
-
15
-
16
-
17
-
18
-
19
-
20
-
21
-
22
-
23
-
24
-
25
-
26
-
27
-
28
-
29
-
30
-
31
-
32
-
33
-
34
-
35
-
36
-
37
-
38
-
39
-
40
-
41
-
42
-
43
-
44
-
45
-
46
-
47
-
48
-
49
-
50
-
51
-
52
-
53
-
54
-
55
-
56
-
57
-
58
-
59
-
60
-
61
-
62
-
63
-
64
-
65
-
66
-
67
-
68
-
69
-
70
-
71
-
72
-
73
-
74
-
75
-
76
-
77
-
78
-
79
-
80
-
81
-
82
-
83
-
84
-
85
-
86
-
87
-
88
-
89
-
90
-
91
-
92
-
93
-
94
-
95
-
96
-
97
-
98
-
99
-
100
-
101
-
102
-
103
-
104
-
105
-
106
-
107
-
108
-
109
-
110
-
 111
111 -
 112
112 -
 113
113 -
 114
114 -
 115
115 -
 116
116 -
 117
117 -
 118
118 -
 119
119 -
 120
120 -
 121
121 -
 122
122 -
 123
123 -
 124
124 -
 125
125 -
 126
126 -
 127
127 -
 128
128 -
 129
129 -
 130
130 -
 131
131 -
132
-
133
-
134
-
135
-
136
-
137
-
138
-
139
-
140
-
141
-
142
-
143
-
144
-
145
-
146
-
147
-
148
-
149
-
150
-
151
-
152
-
153
-
154
-
155
-
156
-
157
-
158
-
159
-
160
-
161
-
162
-
163
-
164
-
165
-
166
-
167
-
168
-
169
-
170
-
171
-
172
-
173
-
174
-
175
-
176
-
177
-
178
-
179
-
180
-
181
-
182
-
183
-
184
-
185
-
186
-
187
-
188
-
189
-
190
-
191
-
192
-
193
-
194
-
195
-
196
-
197
-
198
-
199
-
200
-
201
-
202
-
203
-
204
-
205
-
206
-
207
-
208
-
209
-
210
-
211
-
212
-
213
-
214
-
215
-
216
-
217
-
218
-
219
-
220
-
221
-
222
-
223
-
224
-
225
-
226
-
227
-
228
-
229
-
230
-
231
-
232
-
233
-
234
-
235
-
236
-
237
-
238
-
239
-
240
-
241
-
242
-
243
-
244
-
245
-
246
-
247
-
248
-
249
-
250
-
251
-
252
-
253
-
254
 |
 |

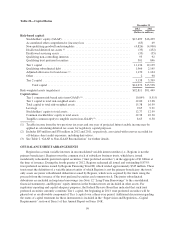
with the established limits. Regions’ parent company cash and cash equivalents as of December 31, 2012 was
$857 million.
Regions’ contractual obligations and expected payment dates are presented in the following table:
Table 30—Contractual Obligations
Payments Due By Period (5)
Less than 1
Year 1-3 Years 4-5 Years
More than 5
Years
Indeterminable
Maturity Total
(In millions)
Deposits (1) ...................... $ 8,581 $2,643 $2,197 $ 22 $82,031 $ 95,474
Short-term borrowings ............. 1,574 — — — — 1,574
Long-term borrowings ............. 751 2,544 4 2,562 — 5,861
Lease obligations ................. 131 236 171 397 — 935
Purchase obligations ............... 22 30 12 — — 64
Benefit obligations (2) .............. 14 30 41 67 — 152
Commitments to fund low income
housing partnerships (3) ........... 280 — — — — 280
Unrecognized tax benefits (4) ........ — — — — 56 56
Indemnification obligation (6) ........ — 345 — — — 345
Visa litigation .................... — — — — 22 22
$11,353 $5,828 $2,425 $3,048 82,109 $104,763
(1) Deposits with indeterminable maturity include non-interest bearing demand, savings, interest-bearing
transaction accounts and money market accounts.
(2) Amounts only include obligations related to the unfunded non-qualified pension plan and postretirement
health care plan.
(3) Commitments to fund low income housing partnerships do not have defined maturity dates. Therefore, they
have been considered due on demand, maturing one year or less.
(4) Includes liabilities for unrecognized tax benefits of $55 million and tax-related interest and penalties of
$1 million. See Note 19 “Income Taxes” to the consolidated financial statements.
(5) See Note 23 “Commitments Contingencies and Guarantees” to the consolidated financial statements for the
Company’s commercial commitments at December 31, 2012.
(6) See Note 23 “Commitments Contingencies and Guarantees” to the consolidated financial statements for a
description of the indemnification obligation to Raymond James, and the rationale for the expected payment
timeframe.
The securities portfolio is one of Regions’ primary sources of liquidity. Maturities of securities provide a
constant flow of funds available for cash needs (see Note 4 “Securities” to the consolidated financial statements).
The agency guaranteed mortgage portfolio is another source of liquidity in various secured borrowing capacities.
Maturities in the loan portfolio also provide a steady flow of funds (see Table 11 “Selected Loan
Maturities”). At December 31, 2012, commercial loans and investor real estate mortgage and construction loans
with an aggregate balance of $10.6 billion were due to mature in one year or less, although Regions may renew
some of these lending arrangements if the risk profile is acceptable. Additionally, securities of $38 million were
due to contractually mature in one year or less. Additional funds are provided from payments on consumer loans
and one-to-four family residential first mortgage loans. In addition, liquidity needs can also be met by borrowing
funds in state and national money markets, although Regions does not currently rely on unsecured wholesale
market funding. Historically, Regions’ liquidity has been enhanced by its relatively stable customer deposit base.
Regions elected to exit the FDIC’s TAG program on July 1, 2010. The TAG program was a component of
the Temporary Liquidity Guarantee Program, whereby the FDIC guaranteed all funds held at participating
institutions beyond the $250,000 deposit insurance limit in qualifying transaction accounts. The decision to exit
105