Regions Bank 2012 Annual Report Download - page 184
Download and view the complete annual report
Please find page 184 of the 2012 Regions Bank annual report below. You can navigate through the pages in the report by either clicking on the pages listed below, or by using the keyword search tool below to find specific information within the annual report.-
 1
1 -
2
-
3
-
4
-
5
-
6
-
7
-
8
-
9
-
10
-
11
-
12
-
13
-
14
-
15
-
16
-
17
-
18
-
19
-
20
-
21
-
22
-
23
-
24
-
25
-
26
-
27
-
28
-
29
-
30
-
31
-
32
-
33
-
34
-
35
-
36
-
37
-
38
-
39
-
40
-
41
-
42
-
43
-
44
-
45
-
46
-
47
-
48
-
49
-
50
-
51
-
52
-
53
-
54
-
55
-
56
-
57
-
58
-
59
-
60
-
61
-
62
-
63
-
64
-
65
-
66
-
67
-
68
-
69
-
70
-
71
-
72
-
73
-
74
-
75
-
76
-
77
-
78
-
79
-
80
-
81
-
82
-
83
-
84
-
85
-
86
-
87
-
88
-
89
-
90
-
91
-
92
-
93
-
94
-
95
-
96
-
97
-
98
-
99
-
100
-
101
-
102
-
103
-
104
-
105
-
106
-
107
-
108
-
109
-
110
-
111
-
112
-
113
-
114
-
115
-
116
-
117
-
118
-
119
-
120
-
121
-
122
-
123
-
124
-
125
-
126
-
127
-
128
-
129
-
130
-
131
-
132
-
133
-
134
-
135
-
136
-
137
-
138
-
139
-
140
-
141
-
142
-
143
-
144
-
145
-
146
-
147
-
148
-
149
-
150
-
151
-
152
-
153
-
154
-
155
-
156
-
157
-
158
-
159
-
160
-
161
-
162
-
163
-
164
-
165
-
166
-
167
-
168
-
169
-
170
-
171
-
172
-
173
-
 174
174 -
 175
175 -
 176
176 -
 177
177 -
 178
178 -
 179
179 -
 180
180 -
 181
181 -
 182
182 -
 183
183 -
 184
184 -
 185
185 -
 186
186 -
 187
187 -
 188
188 -
 189
189 -
 190
190 -
 191
191 -
 192
192 -
 193
193 -
 194
194 -
195
-
196
-
197
-
198
-
199
-
200
-
201
-
202
-
203
-
204
-
205
-
206
-
207
-
208
-
209
-
210
-
211
-
212
-
213
-
214
-
215
-
216
-
217
-
218
-
219
-
220
-
221
-
222
-
223
-
224
-
225
-
226
-
227
-
228
-
229
-
230
-
231
-
232
-
233
-
234
-
235
-
236
-
237
-
238
-
239
-
240
-
241
-
242
-
243
-
244
-
245
-
246
-
247
-
248
-
249
-
250
-
251
-
252
-
253
-
254
 |
 |

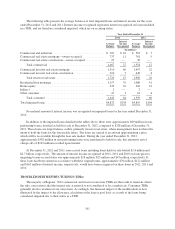
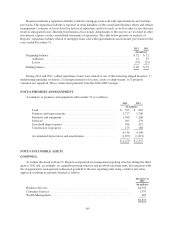
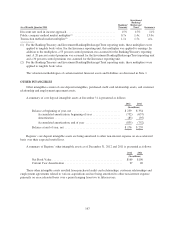
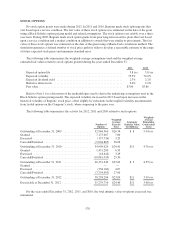
The aggregate amount of amortization expense for core deposit intangible assets, credit card intangibles, and
other intangible assets is estimated as follows:
Year Ended December 31
(In millions)
2013 .......................................... $53
2014 .......................................... 49
2015 .......................................... 44
2016 .......................................... 39
2017 .......................................... 35
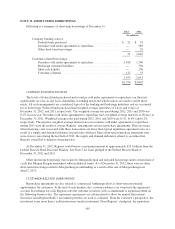
Identifiable intangible assets other than goodwill are reviewed at least annually, usually in the fourth
quarter, for events or circumstances that could impact the recoverability of the intangible asset. These events
could include loss of core deposits, significant losses of credit card accounts and/or balances, increased
competition or adverse changes in the economy. To the extent other identifiable intangible assets are deemed
unrecoverable, impairment losses are recorded in other non-interest expense to reduce the carrying amount.
Regions’ 2012 annual impairment test concluded that no impairment for core deposit intangibles occurred in
2012. Regions noted no indicators of impairment for any other identifiable intangible assets during 2012 or 2011.
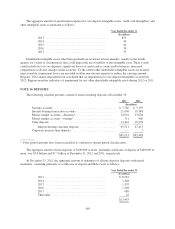
NOTE 10. DEPOSITS
The following schedule presents a detail of interest-bearing deposits at December 31:
2012 2011
(In millions)
Savings accounts .......................................... $ 5,760 $ 5,159
Interest-bearing transaction accounts .......................... 21,096 19,388
Money market accounts—domestic* .......................... 24,901 23,028
Money market accounts—foreign* ............................ 311 460
Time deposits ............................................ 13,443 19,378
Interest-bearing customer deposits ........................ 65,511 67,413
Corporate treasury time deposits .............................. — 5
$65,511 $67,418
* Prior period amounts have been reclassified to conform to current period classification
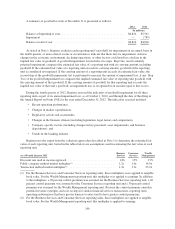
The aggregate amount of time deposits of $100,000 or more, including certificates of deposit of $100,000 or
more, was $5.0 billion and $7.7 billion at December 31, 2012 and 2011, respectively.
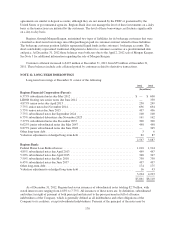
At December 31, 2012, the aggregate amount of maturities of all time deposits (deposits with stated
maturities, consisting primarily of certificates of deposit and IRAs) were as follows:
Year Ended December 31
(In millions)
2013 .......................................... $ 8,581
2014 .......................................... 1,248
2015 .......................................... 1,395
2016 .......................................... 1,208
2017 .......................................... 989
Thereafter ...................................... 22
$13,443
168