Regions Bank 2012 Annual Report Download - page 136
Download and view the complete annual report
Please find page 136 of the 2012 Regions Bank annual report below. You can navigate through the pages in the report by either clicking on the pages listed below, or by using the keyword search tool below to find specific information within the annual report.-
 1
1 -
2
-
3
-
4
-
5
-
6
-
7
-
8
-
9
-
10
-
11
-
12
-
13
-
14
-
15
-
16
-
17
-
18
-
19
-
20
-
21
-
22
-
23
-
24
-
25
-
26
-
27
-
28
-
29
-
30
-
31
-
32
-
33
-
34
-
35
-
36
-
37
-
38
-
39
-
40
-
41
-
42
-
43
-
44
-
45
-
46
-
47
-
48
-
49
-
50
-
51
-
52
-
53
-
54
-
55
-
56
-
57
-
58
-
59
-
60
-
61
-
62
-
63
-
64
-
65
-
66
-
67
-
68
-
69
-
70
-
71
-
72
-
73
-
74
-
75
-
76
-
77
-
78
-
79
-
80
-
81
-
82
-
83
-
84
-
85
-
86
-
87
-
88
-
89
-
90
-
91
-
92
-
93
-
94
-
95
-
96
-
97
-
98
-
99
-
100
-
101
-
102
-
103
-
104
-
105
-
106
-
107
-
108
-
109
-
110
-
111
-
112
-
113
-
114
-
115
-
116
-
117
-
118
-
119
-
120
-
121
-
122
-
123
-
124
-
125
-
 126
126 -
 127
127 -
 128
128 -
 129
129 -
 130
130 -
 131
131 -
 132
132 -
 133
133 -
 134
134 -
 135
135 -
 136
136 -
 137
137 -
 138
138 -
 139
139 -
 140
140 -
 141
141 -
 142
142 -
 143
143 -
 144
144 -
 145
145 -
 146
146 -
147
-
148
-
149
-
150
-
151
-
152
-
153
-
154
-
155
-
156
-
157
-
158
-
159
-
160
-
161
-
162
-
163
-
164
-
165
-
166
-
167
-
168
-
169
-
170
-
171
-
172
-
173
-
174
-
175
-
176
-
177
-
178
-
179
-
180
-
181
-
182
-
183
-
184
-
185
-
186
-
187
-
188
-
189
-
190
-
191
-
192
-
193
-
194
-
195
-
196
-
197
-
198
-
199
-
200
-
201
-
202
-
203
-
204
-
205
-
206
-
207
-
208
-
209
-
210
-
211
-
212
-
213
-
214
-
215
-
216
-
217
-
218
-
219
-
220
-
221
-
222
-
223
-
224
-
225
-
226
-
227
-
228
-
229
-
230
-
231
-
232
-
233
-
234
-
235
-
236
-
237
-
238
-
239
-
240
-
241
-
242
-
243
-
244
-
245
-
246
-
247
-
248
-
249
-
250
-
251
-
252
-
253
-
254
 |
 |

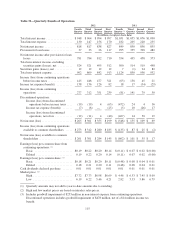
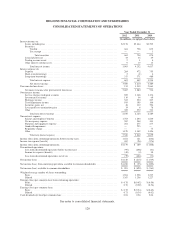
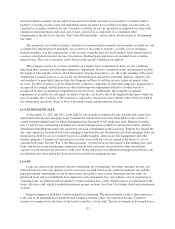
REGIONS FINANCIAL CORPORATION AND SUBSIDIARIES
CONSOLIDATED STATEMENTS OF OPERATIONS
Year Ended December 31
2012 2011 2010
(In millions, except per share data)
Interest income on:
Loans, including fees ............................................................ $3,178 $3,444 $3,705
Securities:
Taxable ................................................................... 681 758 873
Tax-exempt ................................................................ — — 1
Total securities ......................................................... 681 758 874
Loans held for sale .............................................................. 33 36 39
Trading account assets ........................................................... 2 1 4
Other interest-earning assets ....................................................... 9 13 15
Total interest income ........................................................ 3,903 4,252 4,637
Interest expense on:
Deposits ...................................................................... 284 472 755
Short-term borrowings ........................................................... 2 (1) 4
Long-term borrowings ........................................................... 317 371 489
Total interest expense ........................................................ 603 842 1,248
Net interest income .......................................................... 3,300 3,410 3,389
Provision for loan losses .............................................................. 213 1,530 2,863
Net interest income after provision for loan losses ..................................... 3,087 1,880 526
Non-interest income:
Service charges on deposit accounts ................................................ 985 1,168 1,174
Investment fee income ........................................................... 110 64 69
Mortgage income ............................................................... 363 220 247
Trust department income ......................................................... 195 199 196
Securities gains, net ............................................................. 48 112 394
Leveraged lease termination gains .................................................. 14 8 78
Other ......................................................................... 385 372 331
Total non-interest income ..................................................... 2,100 2,143 2,489
Non-interest expense:
Salaries and employee benefits ..................................................... 1,763 1,604 1,640
Net occupancy expense .......................................................... 382 388 411
Furniture and equipment expense ................................................... 261 275 277
Goodwill impairment ............................................................ — 253 —
Regulatory charge ............................................................... — — 75
Other ......................................................................... 1,120 1,342 1,456
Total non-interest expense .................................................... 3,526 3,862 3,859
Income (loss) from continuing operations before income taxes ................................ 1,661 161 (844)
Income tax expense (benefit) .......................................................... 482 (28) (376)
Income (loss) from continuing operations ................................................ $1,179 $ 189 $ (468)
Discontinued operations:
Loss from discontinued operations before income taxes ................................. (99) (408) (41)
Income tax expense (benefit) ...................................................... (40) (4) 30
Loss from discontinued operations, net of tax ......................................... (59) (404) (71)
Net income (loss) ................................................................... $1,120 $ (215) $ (539)
Net income (loss) from continuing operations available to common shareholders ................. $1,050 $ (25) $ (692)
Net income (loss) available to common shareholders ....................................... $ 991 $ (429) $ (763)
Weighted-average number of shares outstanding:
Basic ......................................................................... 1,381 1,258 1,227
Diluted ....................................................................... 1,387 1,258 1,227
Earnings (loss) per common share from continuing operations:
Basic ......................................................................... $ 0.76 $ (0.02) $ (0.56)
Diluted ....................................................................... 0.76 (0.02) (0.56)
Earnings (loss) per common share:
Basic ......................................................................... $ 0.72 $ (0.34) $ (0.62)
Diluted ....................................................................... 0.71 (0.34) (0.62)
Cash dividends declared per common share ............................................... 0.04 0.04 0.04
See notes to consolidated financial statements.
120