Regions Bank 2012 Annual Report Download - page 89
Download and view the complete annual report
Please find page 89 of the 2012 Regions Bank annual report below. You can navigate through the pages in the report by either clicking on the pages listed below, or by using the keyword search tool below to find specific information within the annual report.-
 1
1 -
2
-
3
-
4
-
5
-
6
-
7
-
8
-
9
-
10
-
11
-
12
-
13
-
14
-
15
-
16
-
17
-
18
-
19
-
20
-
21
-
22
-
23
-
24
-
25
-
26
-
27
-
28
-
29
-
30
-
31
-
32
-
33
-
34
-
35
-
36
-
37
-
38
-
39
-
40
-
41
-
42
-
43
-
44
-
45
-
46
-
47
-
48
-
49
-
50
-
51
-
52
-
53
-
54
-
55
-
56
-
57
-
58
-
59
-
60
-
61
-
62
-
63
-
64
-
65
-
66
-
67
-
68
-
69
-
70
-
71
-
72
-
73
-
74
-
75
-
76
-
77
-
78
-
 79
79 -
 80
80 -
 81
81 -
 82
82 -
 83
83 -
 84
84 -
 85
85 -
 86
86 -
 87
87 -
 88
88 -
 89
89 -
 90
90 -
 91
91 -
 92
92 -
 93
93 -
 94
94 -
 95
95 -
 96
96 -
 97
97 -
 98
98 -
 99
99 -
100
-
101
-
102
-
103
-
104
-
105
-
106
-
107
-
108
-
109
-
110
-
111
-
112
-
113
-
114
-
115
-
116
-
117
-
118
-
119
-
120
-
121
-
122
-
123
-
124
-
125
-
126
-
127
-
128
-
129
-
130
-
131
-
132
-
133
-
134
-
135
-
136
-
137
-
138
-
139
-
140
-
141
-
142
-
143
-
144
-
145
-
146
-
147
-
148
-
149
-
150
-
151
-
152
-
153
-
154
-
155
-
156
-
157
-
158
-
159
-
160
-
161
-
162
-
163
-
164
-
165
-
166
-
167
-
168
-
169
-
170
-
171
-
172
-
173
-
174
-
175
-
176
-
177
-
178
-
179
-
180
-
181
-
182
-
183
-
184
-
185
-
186
-
187
-
188
-
189
-
190
-
191
-
192
-
193
-
194
-
195
-
196
-
197
-
198
-
199
-
200
-
201
-
202
-
203
-
204
-
205
-
206
-
207
-
208
-
209
-
210
-
211
-
212
-
213
-
214
-
215
-
216
-
217
-
218
-
219
-
220
-
221
-
222
-
223
-
224
-
225
-
226
-
227
-
228
-
229
-
230
-
231
-
232
-
233
-
234
-
235
-
236
-
237
-
238
-
239
-
240
-
241
-
242
-
243
-
244
-
245
-
246
-
247
-
248
-
249
-
250
-
251
-
252
-
253
-
254
 |
 |
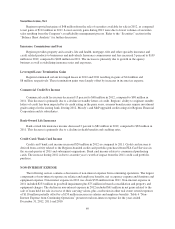
At December 31, 2012, the Company reported a net deferred tax asset of $763 million compared to
$1.3 billion at December 31, 2011. The change is principally due to a decrease in the allowance for loan losses
and utilization of tax credit carryforwards. Of the balance at December 31, 2012, $462 million was generated
from differences between the financial statement carrying amounts and the corresponding tax bases of assets and
liabilities, of which a significant portion relates to the allowance for loan losses. These net deferred tax assets
have not yet reduced taxable income and therefore do not have a set expiration date. The remaining $301 million
net deferred tax asset balance relates to tax carryforwards that have defined expiration dates which are typically
15 or 20 years from the date of creation. Of the $301 million, $68 million of this deferred tax asset is related to
tax carryforwards that have expiration dates prior to the tax year 2025.
The Company continually assesses the realizability of its deferred tax assets based on an evaluative process
that considers all available positive and negative evidence. The Company has established a valuation allowance
in the amount of $70 million at December 31, 2012 and $32 million at December 31, 2011 because the Company
believes that a portion of the state operating loss carryforwards and state tax credit carryforwards will not be
utilized. As part of this evaluative process, management considers the following sources of taxable income: 1)
the future reversals of taxable temporary differences; 2) future taxable income exclusive of reversing temporary
differences and carryforwards; 3) taxable income in prior carryback years; and 4) tax-planning strategies. In
making a conclusion, management has evaluated all available positive and negative evidence impacting these
sources of taxable income. The primary sources of evidence impacting management’s judgment regarding the
realization of the Company’s deferred tax assets are summarized below.
• History of earnings—As of December 31, 2012, the Company has reestablished a positive earnings
trend and is not in a three-year cumulative loss position. Therefore, the Company no longer has this
negative evidence to consider in the valuation of its deferred tax assets. The Company did not generate
any federal net operating losses or tax credit carryforwards until 2009, and in 2011 the Company
utilized all federal net operating losses. In 2012, the Company utilized a significant portion of its
federal tax credit carryforwards. There is no history of significant tax carryforwards expiring unused.
• Reversals of taxable temporary differences—The Company anticipates that future reversals of taxable
temporary differences, including the accretion of taxable temporary differences related to leveraged
leases acquired in a prior business combination, can absorb up to approximately $812 million of
deferred tax assets.
• Creation of future taxable income—The Company has projected future taxable income that will be
sufficient to absorb the remaining deferred tax assets after the reversal of future taxable temporary
differences. The taxable income forecasting process utilizes the forecasted pre-tax earnings and adjusts
for book-tax differences that will be exempt from taxation, primarily tax-exempt interest income and
bank-owned life insurance, as well as temporary book-tax differences including the allowance for loan
losses. The projections relied upon for this process are consistent with those used in the Company’s
financial forecasting process.
• Ability to implement tax-planning strategies—The Company has the ability to implement tax planning
strategies to maximize the realization of deferred tax assets, such as the sale of assets. As an example,
at December 31, 2012, the Company’s portfolio of securities available for sale had $729 million of
gross unrealized pre-tax gains which could accelerate the recognition of the associated taxable
temporary differences, which management would consider being a tax planning strategy to maximize
the realization of the deferred tax assets that may expire unutilized.
The Company completed the sale of Morgan Keegan and related affiliates to Raymond James on April 2,
2012. The Company has reflected the transaction as if Raymond James purchased the assets of the entities for tax
purposes and in January 2013, income tax elections were finalized that are consistent with this treatment.
The Company’s effective tax rate is affected by recurring items such as affordable housing tax credits, bank-
owned life insurance and tax-exempt income, which are expected to be consistent in the near term. The effective
73