Regions Bank 2012 Annual Report Download - page 187
Download and view the complete annual report
Please find page 187 of the 2012 Regions Bank annual report below. You can navigate through the pages in the report by either clicking on the pages listed below, or by using the keyword search tool below to find specific information within the annual report.-
 1
1 -
2
-
3
-
4
-
5
-
6
-
7
-
8
-
9
-
10
-
11
-
12
-
13
-
14
-
15
-
16
-
17
-
18
-
19
-
20
-
21
-
22
-
23
-
24
-
25
-
26
-
27
-
28
-
29
-
30
-
31
-
32
-
33
-
34
-
35
-
36
-
37
-
38
-
39
-
40
-
41
-
42
-
43
-
44
-
45
-
46
-
47
-
48
-
49
-
50
-
51
-
52
-
53
-
54
-
55
-
56
-
57
-
58
-
59
-
60
-
61
-
62
-
63
-
64
-
65
-
66
-
67
-
68
-
69
-
70
-
71
-
72
-
73
-
74
-
75
-
76
-
77
-
78
-
79
-
80
-
81
-
82
-
83
-
84
-
85
-
86
-
87
-
88
-
89
-
90
-
91
-
92
-
93
-
94
-
95
-
96
-
97
-
98
-
99
-
100
-
101
-
102
-
103
-
104
-
105
-
106
-
107
-
108
-
109
-
110
-
111
-
112
-
113
-
114
-
115
-
116
-
117
-
118
-
119
-
120
-
121
-
122
-
123
-
124
-
125
-
126
-
127
-
128
-
129
-
130
-
131
-
132
-
133
-
134
-
135
-
136
-
137
-
138
-
139
-
140
-
141
-
142
-
143
-
144
-
145
-
146
-
147
-
148
-
149
-
150
-
151
-
152
-
153
-
154
-
155
-
156
-
157
-
158
-
159
-
160
-
161
-
162
-
163
-
164
-
165
-
166
-
167
-
168
-
169
-
170
-
171
-
172
-
173
-
174
-
175
-
176
-
 177
177 -
 178
178 -
 179
179 -
 180
180 -
 181
181 -
 182
182 -
 183
183 -
 184
184 -
 185
185 -
 186
186 -
 187
187 -
 188
188 -
 189
189 -
 190
190 -
 191
191 -
 192
192 -
 193
193 -
 194
194 -
 195
195 -
 196
196 -
 197
197 -
198
-
199
-
200
-
201
-
202
-
203
-
204
-
205
-
206
-
207
-
208
-
209
-
210
-
211
-
212
-
213
-
214
-
215
-
216
-
217
-
218
-
219
-
220
-
221
-
222
-
223
-
224
-
225
-
226
-
227
-
228
-
229
-
230
-
231
-
232
-
233
-
234
-
235
-
236
-
237
-
238
-
239
-
240
-
241
-
242
-
243
-
244
-
245
-
246
-
247
-
248
-
249
-
250
-
251
-
252
-
253
-
254
 |
 |

accelerated only in the case of certain events involving bankruptcy, insolvency proceedings or reorganization of
the Company. In May of 2012, approximately $600 million of subordinated notes matured. The subordinated
notes described above qualify as Tier 2 capital under Federal Reserve guidelines. None of the subordinated notes
are redeemable prior to maturity.
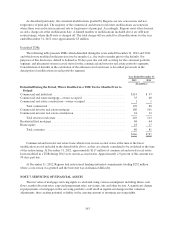
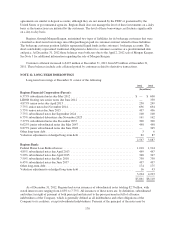
As of December 31, 2012, Regions had outstanding approximately $498 million of junior subordinated
notes (“JSNs”) to affiliated trusts, which contemporaneously issued trust preferred securities which Regions
guaranteed. During the fourth quarter of 2012, Regions redeemed its 8.875% Junior Subordinated Notes due
2048. The aggregate principal amount of these notes was approximately $345 million.
FHLB advances at December 31, 2012, 2011 and 2010 had a weighted-average interest rate of 1.4%, 1.0%
and 1.0%, respectively, with maturities ranging from one to nineteen years. FHLB borrowings are contingent
upon the amount of collateral pledged to the FHLB. Regions has pledged certain loans as collateral for the FHLB
advances outstanding. See Note 5 for loans pledged to the FHLB at December 31, 2012 and 2011. Additionally,
membership in the FHLB requires an institution to hold FHLB stock. See Note 4 for the amount of FHLB stock
held at December 31, 2012 and 2011. During 2012, Regions prepaid approximately $902 million of FHLB
advances, realizing an immaterial pre-tax loss on early extinguishment. These extinguishments were part of the
Company’s asset/liability management process. Regions’ borrowing availability with the FHLB as of
December 31, 2012, based on assets available for collateral at that date, was $6.7 billion.
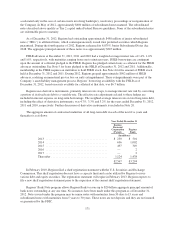
Regions uses derivative instruments, primarily interest rate swaps, to manage interest rate risk by converting
a portion of its fixed-rate debt to a variable-rate. The effective rate adjustments related to these hedges are
included in interest expense on long-term borrowings. The weighted-average interest rate on total long-term debt,
including the effect of derivative instruments, was 4.7%, 3.3% and 3.2% for the years ended December 31, 2012,
2011 and 2010, respectively. Further discussion of derivative instruments is included in Note 20.
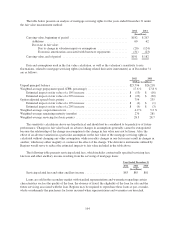
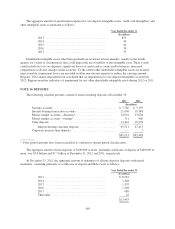
The aggregate amount of contractual maturities of all long-term debt in each of the next five years and
thereafter is as follows:
Year Ended December 31
Regions
Financial
Corporation
(Parent)
Regions
Bank
(In millions)
2013 .......................................... $ 250 $ 501
2014 .......................................... 696 1,002
2015 .......................................... 497 349
2016 .......................................... — 2
2017 .......................................... — 2
Thereafter ...................................... 1,124 1,438
$2,567 $3,294
In February 2010, Regions filed a shelf registration statement with the U.S. Securities and Exchange
Commission. This shelf registration does not have a capacity limit and can be utilized by Regions to issue
various debt and equity securities. The registration statement will expire in February 2013. Regions expects to
file a new shelf registration statement prior to the expiration of the current shelf registration statement.
Regions’ Bank Note program allows Regions Bank to issue up to $20 billion aggregate principal amount of
bank notes outstanding at any one time. No issuances have been made under this program as of December 31,
2012. Notes issued under the program may be senior notes with maturities from 30 days to 15 years and
subordinated notes with maturities from 5 years to 30 years. These notes are not deposits and they are not insured
or guaranteed by the FDIC.
171