Regions Bank 2012 Annual Report Download - page 191
Download and view the complete annual report
Please find page 191 of the 2012 Regions Bank annual report below. You can navigate through the pages in the report by either clicking on the pages listed below, or by using the keyword search tool below to find specific information within the annual report.-
 1
1 -
2
-
3
-
4
-
5
-
6
-
7
-
8
-
9
-
10
-
11
-
12
-
13
-
14
-
15
-
16
-
17
-
18
-
19
-
20
-
21
-
22
-
23
-
24
-
25
-
26
-
27
-
28
-
29
-
30
-
31
-
32
-
33
-
34
-
35
-
36
-
37
-
38
-
39
-
40
-
41
-
42
-
43
-
44
-
45
-
46
-
47
-
48
-
49
-
50
-
51
-
52
-
53
-
54
-
55
-
56
-
57
-
58
-
59
-
60
-
61
-
62
-
63
-
64
-
65
-
66
-
67
-
68
-
69
-
70
-
71
-
72
-
73
-
74
-
75
-
76
-
77
-
78
-
79
-
80
-
81
-
82
-
83
-
84
-
85
-
86
-
87
-
88
-
89
-
90
-
91
-
92
-
93
-
94
-
95
-
96
-
97
-
98
-
99
-
100
-
101
-
102
-
103
-
104
-
105
-
106
-
107
-
108
-
109
-
110
-
111
-
112
-
113
-
114
-
115
-
116
-
117
-
118
-
119
-
120
-
121
-
122
-
123
-
124
-
125
-
126
-
127
-
128
-
129
-
130
-
131
-
132
-
133
-
134
-
135
-
136
-
137
-
138
-
139
-
140
-
141
-
142
-
143
-
144
-
145
-
146
-
147
-
148
-
149
-
150
-
151
-
152
-
153
-
154
-
155
-
156
-
157
-
158
-
159
-
160
-
161
-
162
-
163
-
164
-
165
-
166
-
167
-
168
-
169
-
170
-
171
-
172
-
173
-
174
-
175
-
176
-
177
-
178
-
179
-
180
-
 181
181 -
 182
182 -
 183
183 -
 184
184 -
 185
185 -
 186
186 -
 187
187 -
 188
188 -
 189
189 -
 190
190 -
 191
191 -
 192
192 -
 193
193 -
 194
194 -
 195
195 -
 196
196 -
 197
197 -
 198
198 -
 199
199 -
 200
200 -
 201
201 -
202
-
203
-
204
-
205
-
206
-
207
-
208
-
209
-
210
-
211
-
212
-
213
-
214
-
215
-
216
-
217
-
218
-
219
-
220
-
221
-
222
-
223
-
224
-
225
-
226
-
227
-
228
-
229
-
230
-
231
-
232
-
233
-
234
-
235
-
236
-
237
-
238
-
239
-
240
-
241
-
242
-
243
-
244
-
245
-
246
-
247
-
248
-
249
-
250
-
251
-
252
-
253
-
254
 |
 |

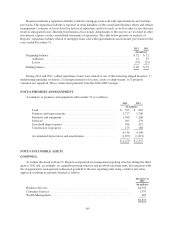
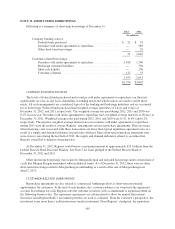
At December 31, 2012, there were approximately 38,392,000 shares reserved for issuance under stock
compensation plans. Stock options outstanding represent approximately 38,258,000 shares and approximately
134,000 shares are reserved for issuance under deferred compensation plans.
At December 31, 2012, Regions had 23 million common shares available for repurchase through open
market transactions under an existing share repurchase authorization. There were no treasury stock purchases
through open market transactions during 2012 or 2011.
The Board of Directors declared a $0.04 annual cash dividend on its common stock for 2012, 2011 and
2010. During the fourth quarter of 2012, the Company determined that cash dividends related to common stock
should reduce the additional paid-in capital component of stockholders’ equity rather than retained earnings
while in a retained deficit position. This error resulted in a reclassification of common stock cash dividends
between additional paid-in capital and retained earnings (deficit). Management has determined that the effect of
this item is immaterial to prior reporting periods affected. The Company did reclassify all prior year amounts
presented to conform to the current period classification. The cumulative amount of the reclassification was $246
million, of which $105 million related to periods prior to 2010. The reclassification had no impact on total
stockholders’ equity, regulatory capital or regulatory capital ratios.
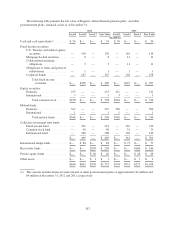
Activity within the balances in accumulated other comprehensive income (loss) is shown in the following
tables for the years ended December 31 as follows:
2012
Unrealized gains
on securities
available for sale
Unrealized gains
on derivative
instruments
designated as cash
flow hedges
Defined benefit
pension plans and
other post
employment
benefits
Accumulated
other
comprehensive
income (loss), net
of tax
(In millions)
Beginning of period ................... $322 $84 $(475) $ (69)
Net change ...................... 114 9 11 134
End of period ........................ $436 $93 $(464) $ 65
2011
Unrealized gains
on securities
available for sale
Unrealized gains
on derivative
instruments
designated as cash
flow hedges
Defined benefit
pension plans and
other post
employment
benefits
Accumulated
other
comprehensive
income (loss), net
of tax
(In millions)
Beginning of period ................... $ 78 $(10) $(328) $(260)
Net change ...................... 244 94 (147) 191
End of period ........................ $322 $ 84 $(475) $ (69)
2010
Unrealized gains
on securities
available for sale
Unrealized gains
on derivative
instruments
designated as cash
flow hedges
Defined benefit
pension plans and
other post
employment
benefits
Accumulated
other
comprehensive
income (loss), net
of tax
(In millions)
Beginning of period ................... $272 $156 $(298) $ 130
Net change ...................... (194) (166) (30) (390)
End of period ........................ $ 78 $ (10) $(328) $(260)
175