Regions Bank 2012 Annual Report Download - page 213
Download and view the complete annual report
Please find page 213 of the 2012 Regions Bank annual report below. You can navigate through the pages in the report by either clicking on the pages listed below, or by using the keyword search tool below to find specific information within the annual report.-
 1
1 -
2
-
3
-
4
-
5
-
6
-
7
-
8
-
9
-
10
-
11
-
12
-
13
-
14
-
15
-
16
-
17
-
18
-
19
-
20
-
21
-
22
-
23
-
24
-
25
-
26
-
27
-
28
-
29
-
30
-
31
-
32
-
33
-
34
-
35
-
36
-
37
-
38
-
39
-
40
-
41
-
42
-
43
-
44
-
45
-
46
-
47
-
48
-
49
-
50
-
51
-
52
-
53
-
54
-
55
-
56
-
57
-
58
-
59
-
60
-
61
-
62
-
63
-
64
-
65
-
66
-
67
-
68
-
69
-
70
-
71
-
72
-
73
-
74
-
75
-
76
-
77
-
78
-
79
-
80
-
81
-
82
-
83
-
84
-
85
-
86
-
87
-
88
-
89
-
90
-
91
-
92
-
93
-
94
-
95
-
96
-
97
-
98
-
99
-
100
-
101
-
102
-
103
-
104
-
105
-
106
-
107
-
108
-
109
-
110
-
111
-
112
-
113
-
114
-
115
-
116
-
117
-
118
-
119
-
120
-
121
-
122
-
123
-
124
-
125
-
126
-
127
-
128
-
129
-
130
-
131
-
132
-
133
-
134
-
135
-
136
-
137
-
138
-
139
-
140
-
141
-
142
-
143
-
144
-
145
-
146
-
147
-
148
-
149
-
150
-
151
-
152
-
153
-
154
-
155
-
156
-
157
-
158
-
159
-
160
-
161
-
162
-
163
-
164
-
165
-
166
-
167
-
168
-
169
-
170
-
171
-
172
-
173
-
174
-
175
-
176
-
177
-
178
-
179
-
180
-
181
-
182
-
183
-
184
-
185
-
186
-
187
-
188
-
189
-
190
-
191
-
192
-
193
-
194
-
195
-
196
-
197
-
198
-
199
-
200
-
201
-
202
-
 203
203 -
 204
204 -
 205
205 -
 206
206 -
 207
207 -
 208
208 -
 209
209 -
 210
210 -
 211
211 -
 212
212 -
 213
213 -
 214
214 -
 215
215 -
 216
216 -
 217
217 -
 218
218 -
 219
219 -
 220
220 -
 221
221 -
 222
222 -
 223
223 -
224
-
225
-
226
-
227
-
228
-
229
-
230
-
231
-
232
-
233
-
234
-
235
-
236
-
237
-
238
-
239
-
240
-
241
-
242
-
243
-
244
-
245
-
246
-
247
-
248
-
249
-
250
-
251
-
252
-
253
-
254
 |
 |
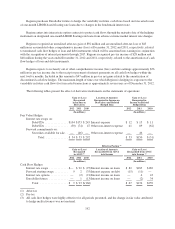
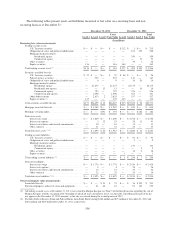
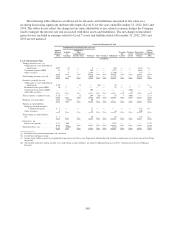
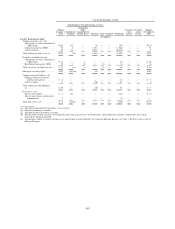
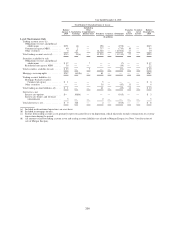
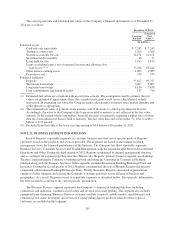
(3) At December 31, 2012, derivatives include approximately $1.1 billion related to legally enforceable master netting agreements that allow
the Company to settle positive and negative positions. Derivatives are also presented excluding cash collateral received of $55 million
and cash collateral posted of $827 million with counterparties. At December 31, 2011, derivatives include approximately $1.4 billion
related to legally enforceable master netting agreements that allow the Company to settle positive and negative positions. Derivatives are
also presented excluding cash collateral received of $55 million and cash collateral posted of $732 million with counterparties.
(4) Derivative assets and liabilities both include $454 million of interest rate swaps and $23 million of interest rate options at December 31,
2011 related to Morgan Keegan, all of which are classified as Level 2 in the table. These items do not appear in the December 31, 2012
amounts, as they were included with the sale of Morgan Keegan.
(5) All trading account liabilities are related to Morgan Keegan at December 31, 2011. These items do not appear in the December 31, 2012
amounts as they were included with the sale of Morgan Keegan.
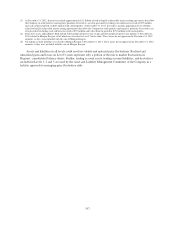
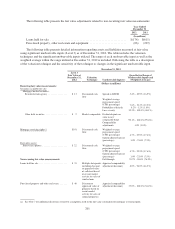
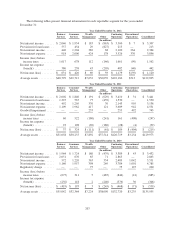
Assets and liabilities in all levels could result in volatile and material price fluctuations. Realized and
unrealized gains and losses on Level 3 assets represent only a portion of the risk to market fluctuations in
Regions’ consolidated balance sheets. Further, trading account assets, trading account liabilities, and derivatives
included in Levels 1, 2 and 3 are used by the Asset and Liability Management Committee of the Company in a
holistic approach to managing price fluctuation risks.
197