Regions Bank 2012 Annual Report Download - page 165
Download and view the complete annual report
Please find page 165 of the 2012 Regions Bank annual report below. You can navigate through the pages in the report by either clicking on the pages listed below, or by using the keyword search tool below to find specific information within the annual report.-
 1
1 -
2
-
3
-
4
-
5
-
6
-
7
-
8
-
9
-
10
-
11
-
12
-
13
-
14
-
15
-
16
-
17
-
18
-
19
-
20
-
21
-
22
-
23
-
24
-
25
-
26
-
27
-
28
-
29
-
30
-
31
-
32
-
33
-
34
-
35
-
36
-
37
-
38
-
39
-
40
-
41
-
42
-
43
-
44
-
45
-
46
-
47
-
48
-
49
-
50
-
51
-
52
-
53
-
54
-
55
-
56
-
57
-
58
-
59
-
60
-
61
-
62
-
63
-
64
-
65
-
66
-
67
-
68
-
69
-
70
-
71
-
72
-
73
-
74
-
75
-
76
-
77
-
78
-
79
-
80
-
81
-
82
-
83
-
84
-
85
-
86
-
87
-
88
-
89
-
90
-
91
-
92
-
93
-
94
-
95
-
96
-
97
-
98
-
99
-
100
-
101
-
102
-
103
-
104
-
105
-
106
-
107
-
108
-
109
-
110
-
111
-
112
-
113
-
114
-
115
-
116
-
117
-
118
-
119
-
120
-
121
-
122
-
123
-
124
-
125
-
126
-
127
-
128
-
129
-
130
-
131
-
132
-
133
-
134
-
135
-
136
-
137
-
138
-
139
-
140
-
141
-
142
-
143
-
144
-
145
-
146
-
147
-
148
-
149
-
150
-
151
-
152
-
153
-
154
-
 155
155 -
 156
156 -
 157
157 -
 158
158 -
 159
159 -
 160
160 -
 161
161 -
 162
162 -
 163
163 -
 164
164 -
 165
165 -
 166
166 -
 167
167 -
 168
168 -
 169
169 -
 170
170 -
 171
171 -
 172
172 -
 173
173 -
 174
174 -
 175
175 -
176
-
177
-
178
-
179
-
180
-
181
-
182
-
183
-
184
-
185
-
186
-
187
-
188
-
189
-
190
-
191
-
192
-
193
-
194
-
195
-
196
-
197
-
198
-
199
-
200
-
201
-
202
-
203
-
204
-
205
-
206
-
207
-
208
-
209
-
210
-
211
-
212
-
213
-
214
-
215
-
216
-
217
-
218
-
219
-
220
-
221
-
222
-
223
-
224
-
225
-
226
-
227
-
228
-
229
-
230
-
231
-
232
-
233
-
234
-
235
-
236
-
237
-
238
-
239
-
240
-
241
-
242
-
243
-
244
-
245
-
246
-
247
-
248
-
249
-
250
-
251
-
252
-
253
-
254
 |
 |

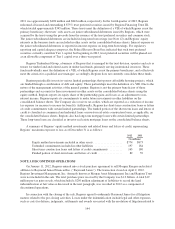
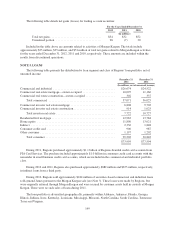
The following table details net gains (losses) for trading account securities:
For the Years Ended December 31
2012 2011 2010
(In millions)
Total net gains ................................... $34 $32 $52
Unrealized portion ............................... 28 (7) 30
Included in the table above are amounts related to activities of Morgan Keegan. The totals include
approximately $25 million, $35 million, and $51 million of total net gains related to Morgan Keegan activities
for the years ended December 31, 2012, 2011 and 2010, respectively. These amounts are included within the
results from discontinued operations.
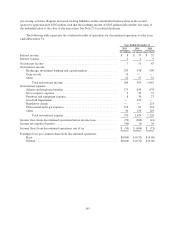
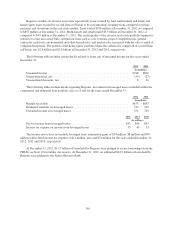
NOTE 5. LOANS
The following table presents the distribution by loan segment and class of Regions’ loan portfolio, net of
unearned income:
December 31
2012
December 31
2011
(In millions, net of unearned income)
Commercial and industrial .......................................... $26,674 $24,522
Commercial real estate mortgage—owner-occupied ...................... 10,095 11,166
Commercial real estate construction—owner-occupied .................... 302 337
Total commercial ............................................. 37,071 36,025
Commercial investor real estate mortgage .............................. 6,808 9,702
Commercial investor real estate construction ............................ 914 1,025
Total investor real estate ........................................ 7,722 10,727
Residential first mortgage ........................................... 12,963 13,784
Home equity ..................................................... 11,800 13,021
Indirect ......................................................... 2,336 1,848
Consumer credit card .............................................. 906 987
Other consumer ................................................... 1,197 1,202
Total consumer ............................................... 29,202 30,842
$73,995 $77,594
During 2011, Regions purchased approximately $1.1 billion of Regions-branded credit card accounts from
FIA Card Services. The purchase included approximately $1.0 billion in consumer credit card accounts with the
remainder in small business credit card accounts, which are included in the commercial and industrial portfolio
class.
During 2012 and 2011, Regions also purchased approximately $882 million and $675 million, respectively,
in indirect loans from a third party.
During 2012, Regions sold approximately $184 million of securities-based commercial and industrial loans
to Raymond James pursuant to the Morgan Keegan sale (see Note 3). These loans were made by Regions, but
were originally referred through Morgan Keegan and were secured by customer assets held in custody at Morgan
Keegan. There were no such sales of loans during 2011.
The loan portfolio is diversified geographically, primarily within Alabama, Arkansas, Florida, Georgia,
Illinois, Indiana, Iowa, Kentucky, Louisiana, Mississippi, Missouri, North Carolina, South Carolina, Tennessee,
Texas and Virginia.
149