Regions Bank 2012 Annual Report Download - page 79
Download and view the complete annual report
Please find page 79 of the 2012 Regions Bank annual report below. You can navigate through the pages in the report by either clicking on the pages listed below, or by using the keyword search tool below to find specific information within the annual report.-
 1
1 -
2
-
3
-
4
-
5
-
6
-
7
-
8
-
9
-
10
-
11
-
12
-
13
-
14
-
15
-
16
-
17
-
18
-
19
-
20
-
21
-
22
-
23
-
24
-
25
-
26
-
27
-
28
-
29
-
30
-
31
-
32
-
33
-
34
-
35
-
36
-
37
-
38
-
39
-
40
-
41
-
42
-
43
-
44
-
45
-
46
-
47
-
48
-
49
-
50
-
51
-
52
-
53
-
54
-
55
-
56
-
57
-
58
-
59
-
60
-
61
-
62
-
63
-
64
-
65
-
66
-
67
-
68
-
 69
69 -
 70
70 -
 71
71 -
 72
72 -
 73
73 -
 74
74 -
 75
75 -
 76
76 -
 77
77 -
 78
78 -
 79
79 -
 80
80 -
 81
81 -
 82
82 -
 83
83 -
 84
84 -
 85
85 -
 86
86 -
 87
87 -
 88
88 -
 89
89 -
90
-
91
-
92
-
93
-
94
-
95
-
96
-
97
-
98
-
99
-
100
-
101
-
102
-
103
-
104
-
105
-
106
-
107
-
108
-
109
-
110
-
111
-
112
-
113
-
114
-
115
-
116
-
117
-
118
-
119
-
120
-
121
-
122
-
123
-
124
-
125
-
126
-
127
-
128
-
129
-
130
-
131
-
132
-
133
-
134
-
135
-
136
-
137
-
138
-
139
-
140
-
141
-
142
-
143
-
144
-
145
-
146
-
147
-
148
-
149
-
150
-
151
-
152
-
153
-
154
-
155
-
156
-
157
-
158
-
159
-
160
-
161
-
162
-
163
-
164
-
165
-
166
-
167
-
168
-
169
-
170
-
171
-
172
-
173
-
174
-
175
-
176
-
177
-
178
-
179
-
180
-
181
-
182
-
183
-
184
-
185
-
186
-
187
-
188
-
189
-
190
-
191
-
192
-
193
-
194
-
195
-
196
-
197
-
198
-
199
-
200
-
201
-
202
-
203
-
204
-
205
-
206
-
207
-
208
-
209
-
210
-
211
-
212
-
213
-
214
-
215
-
216
-
217
-
218
-
219
-
220
-
221
-
222
-
223
-
224
-
225
-
226
-
227
-
228
-
229
-
230
-
231
-
232
-
233
-
234
-
235
-
236
-
237
-
238
-
239
-
240
-
241
-
242
-
243
-
244
-
245
-
246
-
247
-
248
-
249
-
250
-
251
-
252
-
253
-
254
 |
 |
The pro forma fair value analysis presented above demonstrates the sensitivity of fair values to hypothetical
changes in primary mortgage rates. This sensitivity analysis does not reflect an expected outcome. Refer to the
“Mortgage Servicing Rights” discussion in the “Balance Sheet” analysis section found later in this report.
Income Taxes
Accrued income taxes are reported as a component of either other assets or other liabilities, as appropriate,
in the consolidated balance sheets and reflect management’s estimate of income taxes to be paid or received.
Deferred income taxes represent the amount of future income taxes to be paid or received and are accounted
for using the asset and liability method. The net balance is reported in other assets in the consolidated balance
sheets. The Company determines the realization of the deferred tax asset based upon an evaluation of the four
possible sources of taxable income: 1) the future reversals of taxable temporary differences; 2) future taxable
income exclusive of reversing temporary differences and carryforwards; 3) taxable income in prior carryback
years; and 4) tax-planning strategies. In projecting future taxable income, the Company utilizes forecasted pre-
tax earnings, adjusts for the estimated book-tax differences and incorporates assumptions, including the amounts
of income allocable to taxing jurisdictions. These assumptions require significant judgment and are consistent
with the plans and estimates the Company uses to manage the underlying businesses. The realization of the
deferred tax assets could be reduced in the future if these estimates are significantly different than forecasted. For
a detailed discussion of realization of deferred tax assets, refer to the “Income Taxes” section found later in this
report.
The Company is subject to income tax in the U.S. and multiple state and local jurisdictions. The tax laws
and regulations in each jurisdiction may be interpreted differently in certain situations, which could result in a
range of outcomes. Thus, the Company is required to exercise judgment regarding the application of these tax
laws and regulations. The Company will evaluate and recognize tax liabilities related to any tax uncertainties.
Due to the complexity of some of these uncertainties, the ultimate resolution may result in a payment that is
different from the current estimate of the tax liabilities.
The Company’s estimate of accrued income taxes, deferred income taxes and income tax expense can also
change in any period as a result of new legislative or judicial guidance impacting tax positions, as well as
changes in income tax rates. Any changes, if they occur, can be significant to the Company’s financial position,
results of operations or cash flows.
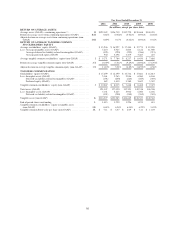
OPERATING RESULTS
GENERAL
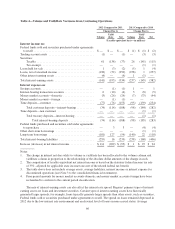
For 2012, Regions reported net income available to common shareholders of $991 million, or $0.71 per
diluted common share. In January 2012, Regions entered into an agreement to sell Morgan Keegan to Raymond
James Financial, Inc. The results of the entities sold are presented as discontinued operations. Refer to Note 3
“Discontinued Operations” of the consolidated financial statements for additional information. Regions reported
net income from continuing operations available to common shareholders of $1,050 million, or $0.76 per diluted
common share in 2012. Regions’ net loss from discontinued operations was $59 million, or ($0.04) per diluted
common share.
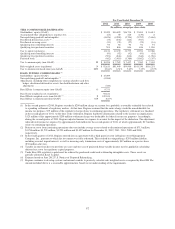
Regions’ 2012 results from continuing operations reflected a significant decline in its provision for loan
losses resulting from continued improving credit metrics and lower non-interest expenses due to a $253 million
non-cash goodwill impairment charge in 2011. Regions also experienced lower net interest income as a result of
a decline in interest-earning asset levels combined with lower earning asset yields, as well as, slightly lower non-
interest income.
63