Regions Bank 2012 Annual Report Download - page 73
Download and view the complete annual report
Please find page 73 of the 2012 Regions Bank annual report below. You can navigate through the pages in the report by either clicking on the pages listed below, or by using the keyword search tool below to find specific information within the annual report.-
 1
1 -
2
-
3
-
4
-
5
-
6
-
7
-
8
-
9
-
10
-
11
-
12
-
13
-
14
-
15
-
16
-
17
-
18
-
19
-
20
-
21
-
22
-
23
-
24
-
25
-
26
-
27
-
28
-
29
-
30
-
31
-
32
-
33
-
34
-
35
-
36
-
37
-
38
-
39
-
40
-
41
-
42
-
43
-
44
-
45
-
46
-
47
-
48
-
49
-
50
-
51
-
52
-
53
-
54
-
55
-
56
-
57
-
58
-
59
-
60
-
61
-
62
-
 63
63 -
 64
64 -
 65
65 -
 66
66 -
 67
67 -
 68
68 -
 69
69 -
 70
70 -
 71
71 -
 72
72 -
 73
73 -
 74
74 -
 75
75 -
 76
76 -
 77
77 -
 78
78 -
 79
79 -
 80
80 -
 81
81 -
 82
82 -
 83
83 -
84
-
85
-
86
-
87
-
88
-
89
-
90
-
91
-
92
-
93
-
94
-
95
-
96
-
97
-
98
-
99
-
100
-
101
-
102
-
103
-
104
-
105
-
106
-
107
-
108
-
109
-
110
-
111
-
112
-
113
-
114
-
115
-
116
-
117
-
118
-
119
-
120
-
121
-
122
-
123
-
124
-
125
-
126
-
127
-
128
-
129
-
130
-
131
-
132
-
133
-
134
-
135
-
136
-
137
-
138
-
139
-
140
-
141
-
142
-
143
-
144
-
145
-
146
-
147
-
148
-
149
-
150
-
151
-
152
-
153
-
154
-
155
-
156
-
157
-
158
-
159
-
160
-
161
-
162
-
163
-
164
-
165
-
166
-
167
-
168
-
169
-
170
-
171
-
172
-
173
-
174
-
175
-
176
-
177
-
178
-
179
-
180
-
181
-
182
-
183
-
184
-
185
-
186
-
187
-
188
-
189
-
190
-
191
-
192
-
193
-
194
-
195
-
196
-
197
-
198
-
199
-
200
-
201
-
202
-
203
-
204
-
205
-
206
-
207
-
208
-
209
-
210
-
211
-
212
-
213
-
214
-
215
-
216
-
217
-
218
-
219
-
220
-
221
-
222
-
223
-
224
-
225
-
226
-
227
-
228
-
229
-
230
-
231
-
232
-
233
-
234
-
235
-
236
-
237
-
238
-
239
-
240
-
241
-
242
-
243
-
244
-
245
-
246
-
247
-
248
-
249
-
250
-
251
-
252
-
253
-
254
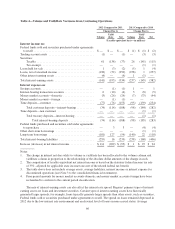
 |
 |

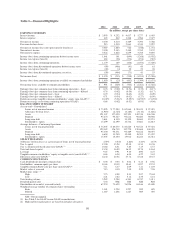
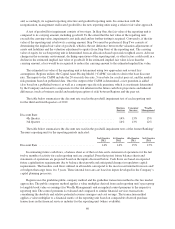
For Year Ended December 31
2012 2011 2010 2009 2008
(In millions, except per share data)
TIER 1 COMMON RISK-BASED RATIO
Stockholders’ equity (GAAP) ................................... $ 15,499 $16,499 $16,734 $ 17,881 $ 16,813
Accumulated other comprehensive (income) loss .................... (65) 69 260 (130) 8
Non-qualifying goodwill and intangibles ........................... (4,826) (4,900) (5,706) (5,792) (5,864)
Disallowed deferred tax assets (4) ................................. (35) (432) (424) (947) —
Disallowed servicing assets ..................................... (33) (35) (27) (25) (16)
Qualifying non-controlling interests ............................... 93 92 92 91 91
Qualifying trust preferred securities ............................... 501 846 846 846 1,036
Tier 1 capital (regulatory) ....................................... 11,134 12,139 11,775 11,924 12,068
Qualifying non-controlling interests ............................... (93) (92) (92) (91) (91)
Qualifying trust preferred securities ............................... (501) (846) (846) (846) (1,036)
Preferred stock ............................................... (482) (3,419) (3,380) (3,602) (3,307)
Tier 1 common equity (non-GAAP) .............................. M $ 10,058 $ 7,782 $ 7,457 $ 7,385 $ 7,634
Risk-weighted assets (regulatory) ................................ N $ 92,811 $91,449 $94,966 $103,330 $116,251
Tier 1 common risk-based ratio (non-GAAP) ....................... M/N 10.84% 8.51% 7.85% 7.15% 6.57%
BASEL III TIER 1 COMMON RATIO (6)
Stockholders’ equity (GAAP) ................................... $ 15,499
Non-qualifying goodwill and intangibles (5) ......................... (4,968)
Adjustments, including other comprehensive income related to cash flow
hedges, disallowed deferred tax assets, threshold deductions and other
adjustments ................................................ (780)
Basel III tier 1 common equity (non-GAAP) ........................ O 9,751
Basel I risk-weighted assets (regulatory) ........................... 92,811
Basel III risk-weighted assets (non-GAAP) (7) ....................... P 109,941
Basel III tier 1 common ratio (non-GAAP) ......................... O/P 8.87%
(1) In the second quarter of 2010, Regions recorded a $200 million charge to account for a probable, reasonably estimable loss related
to a pending settlement of regulatory matters. At that time, Regions assumed that the entire charge would be non-deductible for
income tax purposes. $75 million of the regulatory charge relates to continuing operations. The regulatory settlement was finalized
in the second quarter of 2011. At the time of the settlement, Regions had better information related to the income tax implications.
$125 million of the approximately $200 million settlement charge was deductible for federal income tax purposes. Accordingly,
during the second quarter of 2011, Regions adjusted income tax expense to account for the impact of the deduction. The adjustment
reduced total income tax expense by approximately $44 million for the second quarter of 2011, of which approximately $17 million
relates to continuing operations.
(2) Return on assets from continuing operations does not include average assets related to discontinued operations of $713 million,
$3,254 million, $3,235 million, $3,291 million and $3,492 million for December 31, 2012, 2011, 2010, 2009 and 2008,
respectively.
(3) In the fourth quarter of 2012, Regions entered into an agreement with a third party investor in Regions Asset Management
Company, Inc., pursuant to which the investment was fully redeemed. This resulted in extinguishing a $203 million liability,
including accrued, unpaid interest, as well as incurring early termination costs of approximately $42 million on a pre-tax basis
($38 million after tax).
(4) Taxable income from the two previous tax years and one year of projected future taxable income may be applied in calculating
deferred tax assets for regulatory capital purposes.
(5) Under Basel III, regulatory capital must be reduced by purchased credit card relationship intangible assets. These assets are
partially allowed in Basel I capital.
(6) Estimate based on June 2012 U.S. Notices of Proposed Rulemaking.
(7) Regions continues to develop systems and internal controls to precisely calculate risk-weighted assets as required by Basel III. The
amount included above is a reasonable approximation, based on our understanding of the requirements.
57