Regions Bank 2012 Annual Report Download - page 80
Download and view the complete annual report
Please find page 80 of the 2012 Regions Bank annual report below. You can navigate through the pages in the report by either clicking on the pages listed below, or by using the keyword search tool below to find specific information within the annual report.-
 1
1 -
2
-
3
-
4
-
5
-
6
-
7
-
8
-
9
-
10
-
11
-
12
-
13
-
14
-
15
-
16
-
17
-
18
-
19
-
20
-
21
-
22
-
23
-
24
-
25
-
26
-
27
-
28
-
29
-
30
-
31
-
32
-
33
-
34
-
35
-
36
-
37
-
38
-
39
-
40
-
41
-
42
-
43
-
44
-
45
-
46
-
47
-
48
-
49
-
50
-
51
-
52
-
53
-
54
-
55
-
56
-
57
-
58
-
59
-
60
-
61
-
62
-
63
-
64
-
65
-
66
-
67
-
68
-
69
-
 70
70 -
 71
71 -
 72
72 -
 73
73 -
 74
74 -
 75
75 -
 76
76 -
 77
77 -
 78
78 -
 79
79 -
 80
80 -
 81
81 -
 82
82 -
 83
83 -
 84
84 -
 85
85 -
 86
86 -
 87
87 -
 88
88 -
 89
89 -
 90
90 -
91
-
92
-
93
-
94
-
95
-
96
-
97
-
98
-
99
-
100
-
101
-
102
-
103
-
104
-
105
-
106
-
107
-
108
-
109
-
110
-
111
-
112
-
113
-
114
-
115
-
116
-
117
-
118
-
119
-
120
-
121
-
122
-
123
-
124
-
125
-
126
-
127
-
128
-
129
-
130
-
131
-
132
-
133
-
134
-
135
-
136
-
137
-
138
-
139
-
140
-
141
-
142
-
143
-
144
-
145
-
146
-
147
-
148
-
149
-
150
-
151
-
152
-
153
-
154
-
155
-
156
-
157
-
158
-
159
-
160
-
161
-
162
-
163
-
164
-
165
-
166
-
167
-
168
-
169
-
170
-
171
-
172
-
173
-
174
-
175
-
176
-
177
-
178
-
179
-
180
-
181
-
182
-
183
-
184
-
185
-
186
-
187
-
188
-
189
-
190
-
191
-
192
-
193
-
194
-
195
-
196
-
197
-
198
-
199
-
200
-
201
-
202
-
203
-
204
-
205
-
206
-
207
-
208
-
209
-
210
-
211
-
212
-
213
-
214
-
215
-
216
-
217
-
218
-
219
-
220
-
221
-
222
-
223
-
224
-
225
-
226
-
227
-
228
-
229
-
230
-
231
-
232
-
233
-
234
-
235
-
236
-
237
-
238
-
239
-
240
-
241
-
242
-
243
-
244
-
245
-
246
-
247
-
248
-
249
-
250
-
251
-
252
-
253
-
254
 |
 |
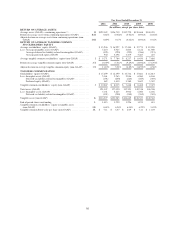
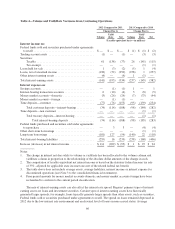
NET INTEREST INCOME AND MARGIN
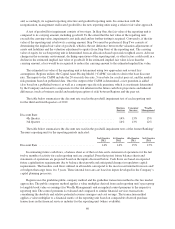
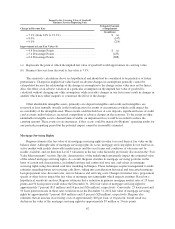
Net interest income (interest income less interest expense) is Regions’ principal source of income and is one
of the most important elements of Regions’ ability to meet its overall performance goals. Net interest income on
a taxable-equivalent basis decreased approximately $95 million, or 2.8 percent in 2012, from 2011 driven by a 4
percent decrease in the level of average earning assets, from $112.2 billion in 2011 to $107.8 billion in 2012. The
net interest margin increased to 3.11 percent in 2012 from 3.07 percent in 2011, reflecting a favorable mix shift
in deposits out of higher cost time deposits into low cost checking, savings and money market accounts.
Comparing 2012 to 2011, interest-earning asset yields were lower, decreasing 15 basis points on average.
However, interest-bearing liability rates were also lower, declining by 23 basis points, more than offsetting the
drop in interest-earning asset yields. As a result, the net interest rate spread increased 8 basis points to
2.86 percent in 2012 compared to 2.78 percent in 2011.
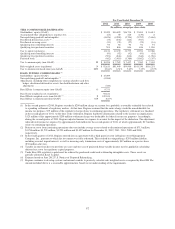
Continued low levels of long-term interest rates affected interest-earning asset yields through their influence
on the behavior and pricing of both variable-rate and fixed-rate loans and securities. Monetary policy action
pursued by the Federal Reserve, as well as a modest pace of economic recovery resulted in sustained low levels
of both long and short term interest rates in 2012. The yield on the benchmark 10-year U.S. Treasury note,
particularly in the second half of 2012, fluctuated mainly in the range of 1.40 percent to 1.80 percent, which is
approximately 100 basis points lower than in 2011. The level of long-term rates has precipitated higher levels of
prepayment, particularly in fixed-rate loans and securities, which can result in the replacement of these assets at
lower rates of interest. This pressure impacts portfolios that have a significant concentration of fixed-rate loans.
For example, the taxable investment securities portfolio, which contains significant residential fixed-rate
exposure, decreased in yield from 3.08 percent in 2011 to 2.55 percent in 2012.
The negative influence of low, long-term interest rates on the net interest margin, however, was offset by
improvements in liability costs. The Federal Reserve’s Rate of Interest on Excess Reserves and the prime rate,
which are influential drivers of loan and deposit pricing on the shorter end of the yield curve, remained low at
approximately 0.25 percent and 3.25 percent, respectively, throughout 2012, which was essentially unchanged
from the previous year-end level. The Company’s loan pricing is also influenced by the 30-day London Interbank
Offering Rate (“LIBOR”), which, on average was 24 basis points 2012. With short-term interest rates remaining
low, deposit costs improved considerably from 0.49 percent in 2011 to 0.30 percent in 2012. There was
substantial improvement in costs in every deposit category, including average money market accounts which
declined from 0.29 percent to 0.18 percent. The improvement in overall deposit costs was also attributable to a
less costly mix of deposits. For example, average time deposits declined from $21.6 billion, or 22.6 percent of
total average deposits, in 2011 to $16.5 billion, or 17.3 percent of total average deposits, in 2012. Meanwhile,
average non-interest bearing customer deposits increased from $27.7 billion in 2011 to $29.4 billion in 2012. Net
interest margin was also supported by a favorable shift of funding to customer deposits from more costly long-
term borrowings. Average long-term borrowings declined to $6.7 billion in 2012 as compared to $11.2 billion in
2011.
64