Regions Bank 2012 Annual Report Download - page 200
Download and view the complete annual report
Please find page 200 of the 2012 Regions Bank annual report below. You can navigate through the pages in the report by either clicking on the pages listed below, or by using the keyword search tool below to find specific information within the annual report.-
 1
1 -
2
-
3
-
4
-
5
-
6
-
7
-
8
-
9
-
10
-
11
-
12
-
13
-
14
-
15
-
16
-
17
-
18
-
19
-
20
-
21
-
22
-
23
-
24
-
25
-
26
-
27
-
28
-
29
-
30
-
31
-
32
-
33
-
34
-
35
-
36
-
37
-
38
-
39
-
40
-
41
-
42
-
43
-
44
-
45
-
46
-
47
-
48
-
49
-
50
-
51
-
52
-
53
-
54
-
55
-
56
-
57
-
58
-
59
-
60
-
61
-
62
-
63
-
64
-
65
-
66
-
67
-
68
-
69
-
70
-
71
-
72
-
73
-
74
-
75
-
76
-
77
-
78
-
79
-
80
-
81
-
82
-
83
-
84
-
85
-
86
-
87
-
88
-
89
-
90
-
91
-
92
-
93
-
94
-
95
-
96
-
97
-
98
-
99
-
100
-
101
-
102
-
103
-
104
-
105
-
106
-
107
-
108
-
109
-
110
-
111
-
112
-
113
-
114
-
115
-
116
-
117
-
118
-
119
-
120
-
121
-
122
-
123
-
124
-
125
-
126
-
127
-
128
-
129
-
130
-
131
-
132
-
133
-
134
-
135
-
136
-
137
-
138
-
139
-
140
-
141
-
142
-
143
-
144
-
145
-
146
-
147
-
148
-
149
-
150
-
151
-
152
-
153
-
154
-
155
-
156
-
157
-
158
-
159
-
160
-
161
-
162
-
163
-
164
-
165
-
166
-
167
-
168
-
169
-
170
-
171
-
172
-
173
-
174
-
175
-
176
-
177
-
178
-
179
-
180
-
181
-
182
-
183
-
184
-
185
-
186
-
187
-
188
-
189
-
 190
190 -
 191
191 -
 192
192 -
 193
193 -
 194
194 -
 195
195 -
 196
196 -
 197
197 -
 198
198 -
 199
199 -
 200
200 -
 201
201 -
 202
202 -
 203
203 -
 204
204 -
 205
205 -
 206
206 -
 207
207 -
 208
208 -
 209
209 -
 210
210 -
211
-
212
-
213
-
214
-
215
-
216
-
217
-
218
-
219
-
220
-
221
-
222
-
223
-
224
-
225
-
226
-
227
-
228
-
229
-
230
-
231
-
232
-
233
-
234
-
235
-
236
-
237
-
238
-
239
-
240
-
241
-
242
-
243
-
244
-
245
-
246
-
247
-
248
-
249
-
250
-
251
-
252
-
253
-
254
 |
 |

For all investments, the Plan attempts to use quoted market prices of identical assets on active exchanges, or
Level 1 measurements. Where such quoted market prices are not available, the Plan typically employs quoted
market prices of similar instruments (including matrix pricing) and/or discounted cash flows to estimate a value
of these securities, or Level 2 measurements. Level 2 discounted cash flow analyses are typically based on
market interest rates, prepayment speeds and/or option adjusted spreads. Level 3 measurements include
discounted cash flow analyses based on assumptions that are not readily observable in the market place. Such
assumptions include projections of future cash flows, including loss assumptions, and discount rates.
Investments held in the retirement plan consist of cash and cash equivalents, fixed income securities (U.S.
Treasury, federal agency securities, mortgage-backed securities, collateralized mortgage obligations, obligations
of states and political subdivisions and corporate bonds), equity securities (primarily common stock and mutual
funds), collective trust funds, hedge funds, real estate funds, private equity and other assets and are recorded at
fair value on a recurring basis. See Note 1 for a description of valuation methodologies related to U.S. Treasuries,
federal agency securities, mortgage-backed securities, obligations of states and political subdivisions and equity
securities. The methodology described in Note 1 for other debt securities is applicable to corporate bonds.
Mutual funds are valued based on quoted market prices of identical assets on active exchanges; these
valuations are Level 1 measurements. Collective trust funds, international hedge funds, real estate funds, private
equity funds and other assets are valued based on net asset value or the valuation of the limited partner’s portion
of the equity of the fund. Third party fund managers provide these valuations based primarily on estimated
valuations of underlying investments. These funds are included in either Level 2 or Level 3, based on the nature
of the underlying investments and on redemption restrictions.
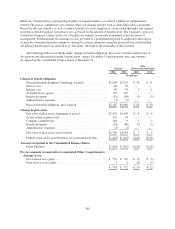
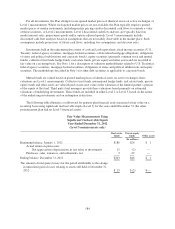
The following table illustrates a rollforward for pension plan financial assets measured at fair value on a
recurring basis using significant unobservable inputs (Level 3) for the years ended December 31 (the other
postretirement plan had no Level 3 financial assets):
Fair Value Measurements Using
Significant Unobservable Inputs
Year Ended December 31, 2012
(Level 3 measurements only)
Real estate
funds
Private equity
funds Other assets
(In millions)
Beginning balance, January 1, 2012 ............................... $186 $26 $ 1
Actual return on plan assets:
Net appreciation (depreciation) in fair value of investments .... 15 (2) —
Purchases, sales, issuances, and settlements, net ................. 2 22 —
Ending balance, December 31, 2012 .............................. $203 $46 $ 1
The amount of total gains (losses) for the period attributable to the change
in unrealized gains (losses) relating to assets still held at December 31,
2012: ..................................................... $ 15 $(2) $—
184